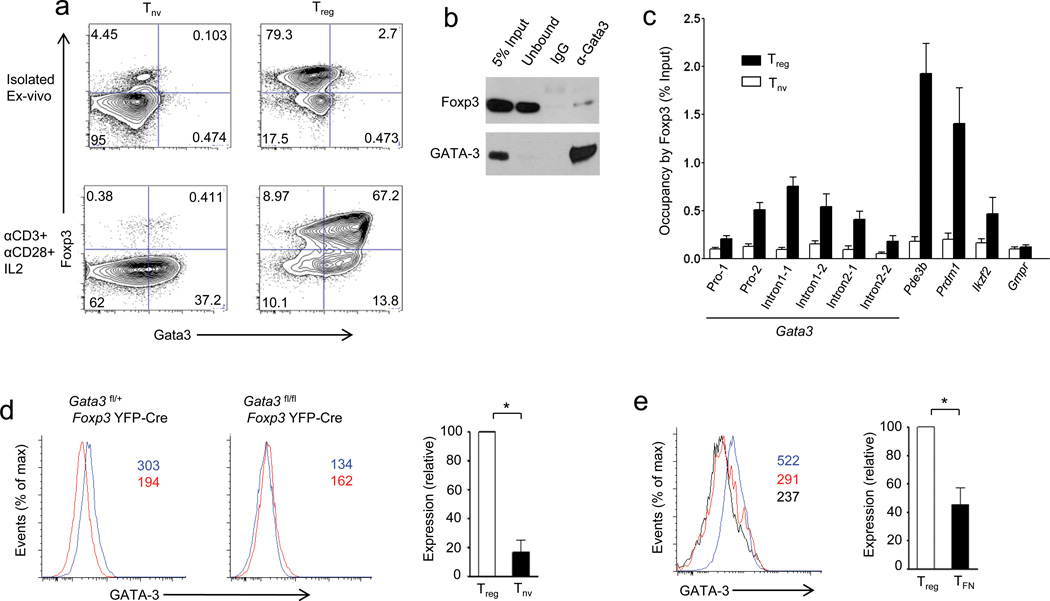
Figure 5.
Foxp3-Gata3 gene regulatory module in Treg cells. (a) Purified CD4+CD25+ (Treg) and CD4+CD25− (Tnv) T cells were stimulated by plate-bound CD3 and CD28 antibodies for 24 h in the presence of IL-2 followed by flow cytometric analysis of intracellular Foxp3 and GATA-3 expression. (b) Co-immunoprecipitation of GATA-3 and Foxp3 from nuclear extracts of activated Treg cells (described in (a)) followed by immunoblot analysis of the indicated proteins. A representative of two independent experiments is shown. (IgG: immunoprecipitation with IgG, α-GATA-3: immunoprecipitation with anti-GATA-3). (c) Immunoprecipitation of Foxp3-bound chromatin isolated from purified CD4+CD25+ Treg cells and control CD4+CD25− T cells using rabbit anti-Foxp3. Foxp3 occupancy of the Gata3 locus was determined by qPCR. Foxp3 binding to Pde3b, Prdm1 and Helios served as positive and to Gmpr as negative controls, respectively. A representative of two independent experiments is shown. (d) GATA-3 expression in CD4+Foxp3+Treg cells (blue line) and CD4+Foxp3− naïve T cells (red line) in mice harboring GATA-3 -sufficient (left) and -deficient (right) Treg cells. (e) GATA-3 expression in Treg (blue line) and TFN (red line) cells from heterozygous female Foxp3GFPKO/WT mice compared to Treg cells lacking GATA-3 (black line). Absolute mean fluorescent intensity (MFI) values are indicated in red and blue in the histogram plots or relative expression (MFI of GATA-3 relative to GATA-3-deficient Treg cells) is shown in the bar graphs. Data are representative of three independent experiments. *P < 0.05 (Student’s t-test).

