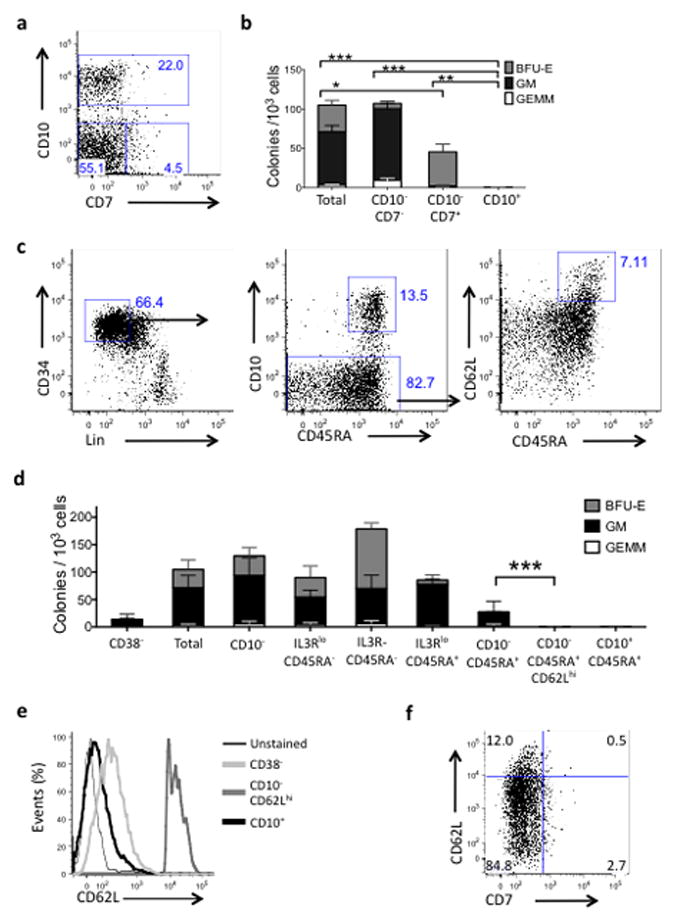
Figure 1. Identification of BM progenitors that lack myeloid and erythroid clonogenic potential.

(a) CD7 and CD10 expression on CD34+lin−Bone Marrow (BM) cells (representative of 7 independent experiments). Error bars represent SEM. * = p<0.050, ** = p<0.010, *** = p<0.001 (b) Myeloid and erythroid clonogenic output in methylcellulose assay of the CD34+lin− subsets shown. (Total n=4, CD10−CD7− and CD10−CD7+ n=2, CD10+ n=5) (c) Flow cytometry isolation strategy of CD34+lin−CD45RA+10+ (“CD10+”) and CD34+lin−CD45RA+CD10−CD62Lhi (“CD10−CD62Lhi ”). Over 30 independent BMs examined (see also Fig S3). (d) Myeloid and erythroid clonogenic capacity of each subset shown. All populations shown, including “total” are CD34+lin−. (p<0.001 comparing CD10−CD45RA+ and CD10−CD45RA+CD62Lhi; frequency was also significantly decreased in CD10− CD62Lhi and CD10+ relative to all other populations shown, see Table S1a, b). IL3Rlo CD45RA−(“CMP”), IL3R−CD45RA−(“MEP”), and IL3Rlo CD45RA+ (“GMP”). (e) CD62L expression on CD34+lin−populations shown, representative of over 20 independent BMs. (f) Flow cytometry of gated CD34+lin−CD10− cells showing lack of CD7 expression on CD62Lhi cells, representative of 5 independent BM. [For all phenotypes, lin− is defined as negative for CD3, CD14, CD15 (aka FUT4), CD19, CD56 (aka NCAM1), and CD235a (aka GYPA)].
