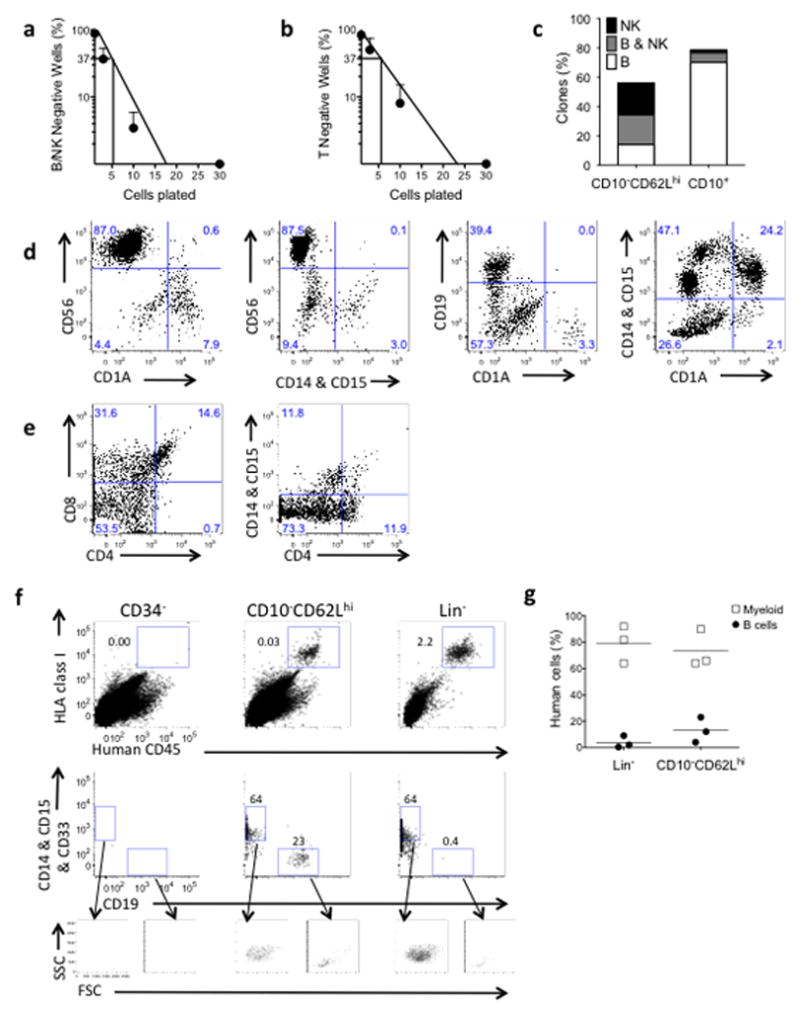
Figure 3. Lineage potential of CD10− CD62Lhi cells by in vitro clonal analyses and in vivo transplantation studies.

(a,b) Limiting dilution analysis of CD10− CD62Lhi cells grown in either : (a) B-NK conditions (cloning efficiency 1 in 5.3, 95% confidence interval 1 in 4.4–6.4, n=3 experiments), or (b) T cell conditions (cloning efficiency 1 in 5.6, 95% confidence interval 1 in 4.6–6.9, n=3 experiments). (c) Lineage analysis of clones from single CD10− CD62Lhi or CD10+ cells in B-NK lymphoid co-culture. Shown is percentage of wells with clonal growth containing B cells, NK cells or both. (d) FACS analysis of clones generated in B-NK conditions from 1–3 CD10− CD62Lhi cells showing NK (CD56+), myeloid (CD14 & CD15) and dendritic (CD1a) potential from one clone (first two panels); B (CD19+) and dendritic (CD1a+) (third panel); co-expression of myeloid and dendritic markers from single cell clone (panel far right). (e) FACS analysis of a single clone generated in T conditions showing T (CD4+CD8+) and myeloid (CD4dimCD14+&CD15+) potential. (f) FACS analysis of NSG mouse BM analyzed 2wk post transplant with 30,000 CD34+lin−CD10− CD62Lhi cells (center) or 150,000 CD34+lin− cells (right). Negative control mouse (left) received 100,000 irradiated CD34− carrier cells only. Human engraftment shown top row as hCD45+HLA-Class 1+ cells, middle row shows B (CD19+) cells and myeloid (CD14, CD15, & CD33+) cells from gated human cells, bottom row shows backgating of B and Myeloid cells shown in each panel above. (g) Compiled data from transplant experiments (n=3 mice each group).
