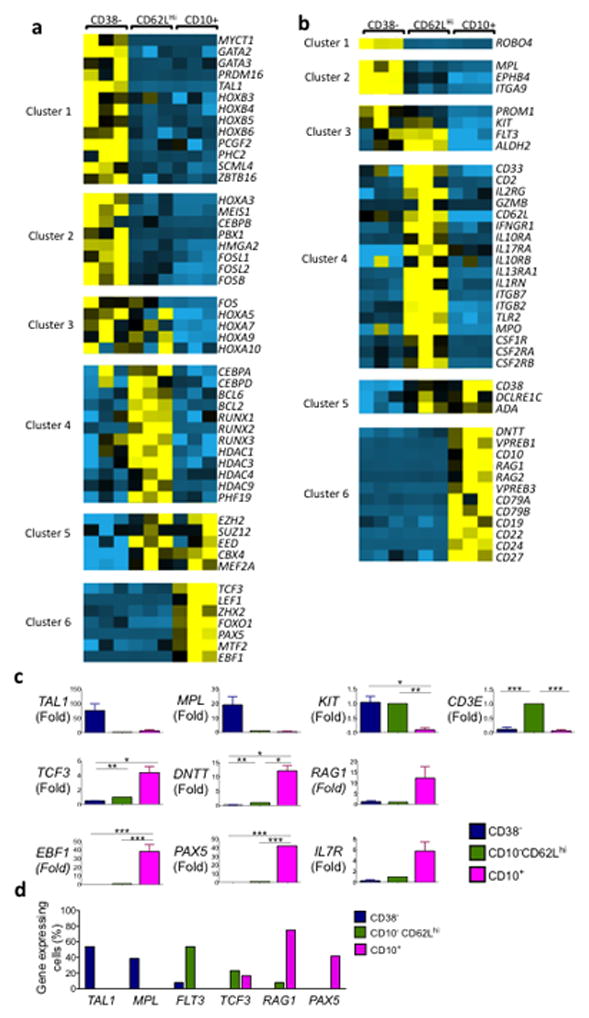
Figure 5. CD10−CD62Lhi cells represent a distinct progenitor population with a unique expression profile that combines hematopoietic stem cell and early lymphoid genes.

(a) Gene expression of transcription factors or (b) cytoplasmic and cell surface molecules. Genes included in cluster designations of heatmap were all more than 2 fold differentially regulated in pair-wise comparisons (p <0.05), and based on statistical analysis (not heatmap appearance) defined as Cluster 1: upregulated only in CD38−, and other 2 populations equivalent i.e. CD38− > (CD10−CD62Lhi = CD10+); Cluster 2: CD38− >CD62Lhi >CD10+; Cluster 3: (CD38− = CD10−CD62Lhi) >CD10+; Cluster 4: CD10−CD62Lhi > (CD38− =CD10+); Cluster 5: (CD10−CD62Lhi = CD10+) >CD38−; Cluster 6: CD10+ > (CD10−CD62Lhi = CD38−). (c) qPCR for selected genes, each normalized to CD10−CD62Lhi (n= 3 biological replicates, * = p≤0.050, ** = p<0.010, *** = p<0.001) mean ± SEM (d) qPCR assay of expression of selected genes in single cells using Fluidigm Biomark 48.48 analyzer (bars represent percentage of single cells tested expressing gene transcript, n=13 cells analyzed per each gene).
