
Figure 2.
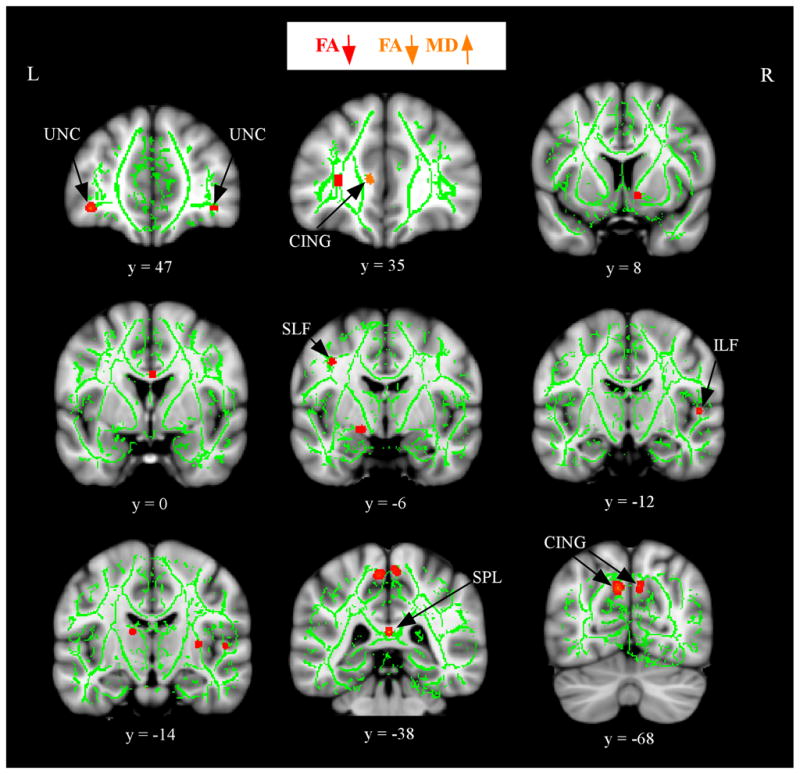
Alterations in FA and MD in aMCI after controlling for WM atrophy. The anatomic underlay used for illustration is the MNI152 T1-weighted 1mm brain. The registered average FA skeleton is represented in green. Regions of decreased FA in the aMCI group are displayed in red. Regions of increased MD that overlap decreased FA in the aMCI group are displayed in orange. The numbers below coronal sections represent y coordinates in MNI space. Note: CING, cingulum; UNC, uncinate fasciculus; SLF, superior longitudinal fasciculus; ILF, inferior longitudinal fasciculus; SPL, splenium.