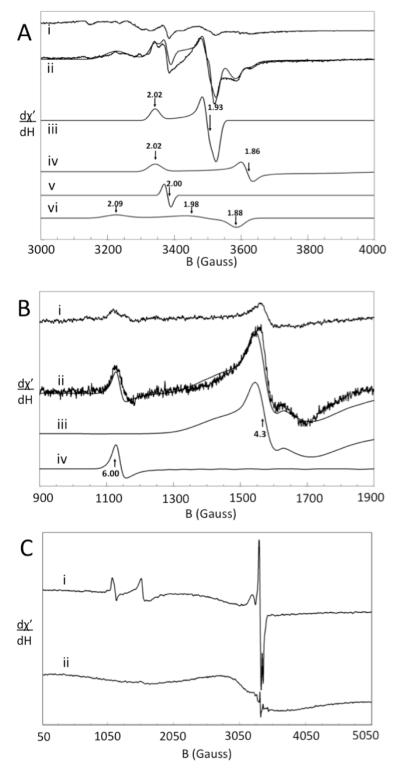
Figure 4.
X-band EPR spectra of Jurkat cells and mitochondria. A, high-field region of (i) cells and (ii) mitochondria (ave. of 5 and 3 scans, respectively). Simulations iii, iv, v, and vi were of the gave = 1.94, 1.90, 2.00, and 1.98 signals, respectively. The solid line overlaying ii is a combined simulation. Temperature, 8 K; frequency, 9.47 GHz; microwave power, 2.012 mW. B, low-field region of (i) cells and (ii) mitochondria (ave. of 5 and 3 scans, respectively). Simulations iii and iv are of the g = 4.3 and 6.0 features, respectively. The solid line overlaying ii is a combined simulation (same EPR conditions). C, wide-sweep spectra of mitochondria at 8 K (i) and 80 K (ii). Frequency, 9.46 GHz, power, 20.12 mW. In all spectra, modulation amplitude was 10 G, modulation frequency, 100 kHz, conversion time, 164 ms, and sweep time, 336 sec.

