
Figure 5.
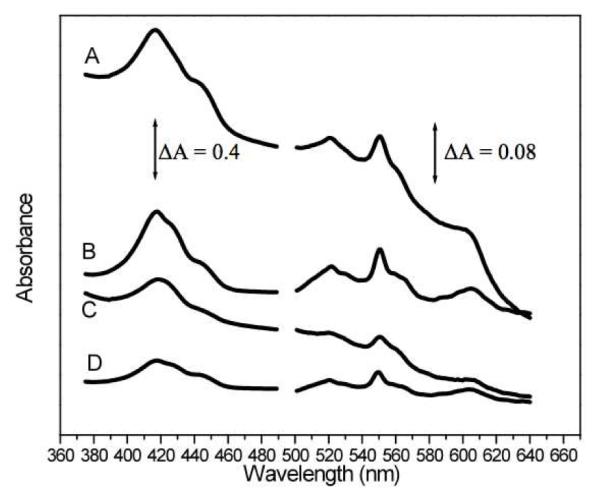
Electronic absorption spectra of mitochondrial (A) and cell (C) suspensions. Simulated spectra B and D were generated by combining individual spectra of isolated proteins containing the different types of hemes.
Official websites use .gov
A
.gov website belongs to an official
government organization in the United States.
Secure .gov websites use HTTPS
A lock (
) or https:// means you've safely
connected to the .gov website. Share sensitive
information only on official, secure websites.
Electronic absorption spectra of mitochondrial (A) and cell (C) suspensions. Simulated spectra B and D were generated by combining individual spectra of isolated proteins containing the different types of hemes.