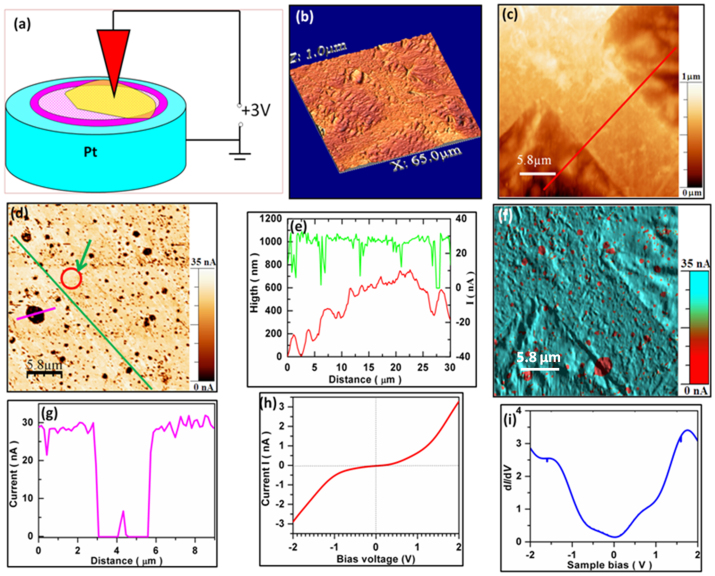
Figure 7. Local current mapping of free-standing graphene membrane on TEM Cu grid.
(a) Schematic of a conductive AFM measurement freely suspended BLG sheet on TEM copper grid in contact mode. (b) AFM topography of large area suspended BLG membrane in contact mode. (c,d) Shows AFM topography of suspended BLG membrane and the corresponding current image with sample bias voltage +3 V DC. (e) Height profile and current measurement along the red line (Fig. 7c) and green line (Fig. 7d), respectively. (f) Shows a combined current and topography image wherein the conducting domain is represented by green color and non-conducting areas are seen as red spots. (g) Shows current plots along the line (indicated by pink color in Fig. 7d). (h,i) Shows local point contact I–V measurement and corresponding dI/dV curve performed on the red circle region (indicated by green arrow in Fig. 7d).

