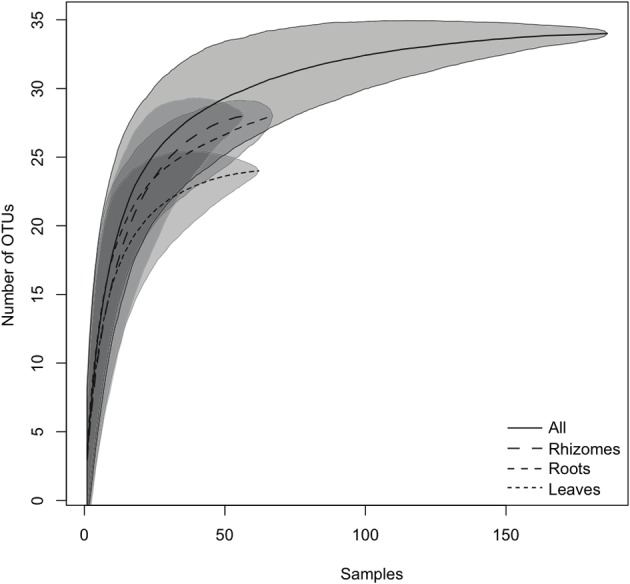
Figure 2.

Species accumulation curves of the endophytic bacterial community found in P. oceanica tissues. The lines indicate the averaged accumulated increase of detected OTUs vs. number of samples (10,000 bootstrap sampling replicates). The shadowed area indicates the standard deviation. The continuous line represents all the samples pooled together, and the dashed lines provide the values for the different tissues.
