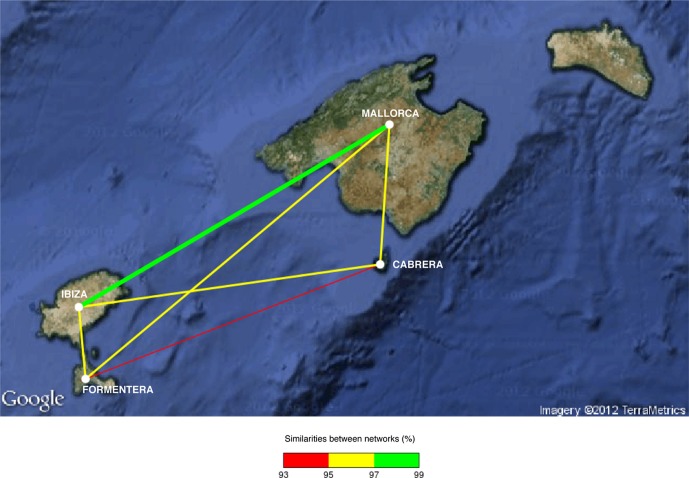
Figure 3.
Bipartite network analysis of endophytic bacterial community of P. oceanica tissues among islands. The nodes represent the islands. Thicker edges between two islands indicate larger similarity of the bipartite networks. Edges are also color-coded to indicate the percentage of similarity between two islands.

