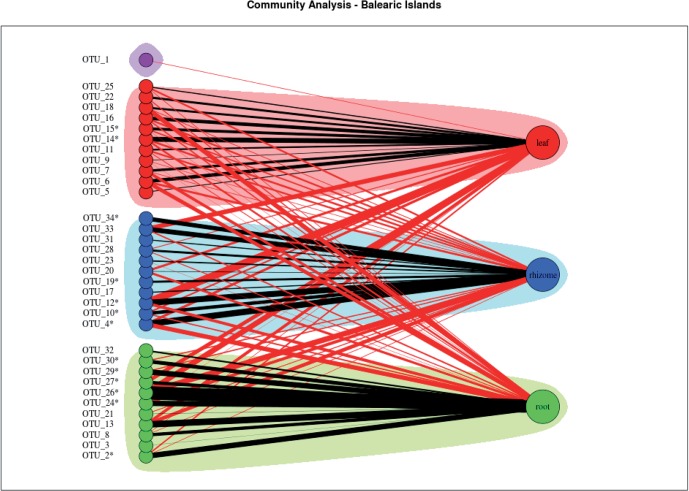
Figure 4.
Community analysis of the bipartite network of all the Balearic Islands studied. Shadowed areas indicate communities strongly associated with leaf (red), rhizome (blue), and root (green). The node representing the OTU 1 was not associated to any community and is shown in purple. Black edges connect nodes at same community, and red edges connect nodes at different communities. The widths of the edges connecting OTUs to tissues are proportional to the total number of observations of each OTU in each tissue divided by the number of replicates. * = Statistically significant.

