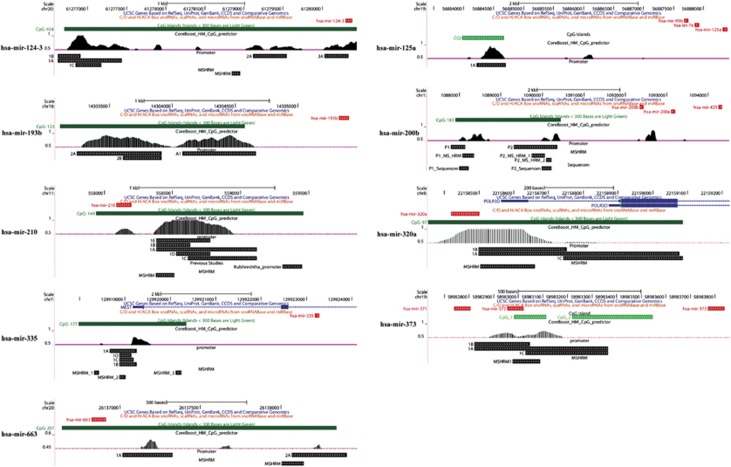
Figure 3.
UCSC screenshots of miRNA candidates and their associated genomic features. Bars representing miRNAs are shown in red, CGIs in green, promoter and methylation-sensitive high-resolution melt analysis fragments in black. Annotated genes are marked in blue. Orientation of genes and fragments are indicated by directional arrows. CoreBoost_HM promoter predictions are shown as black peaks.

