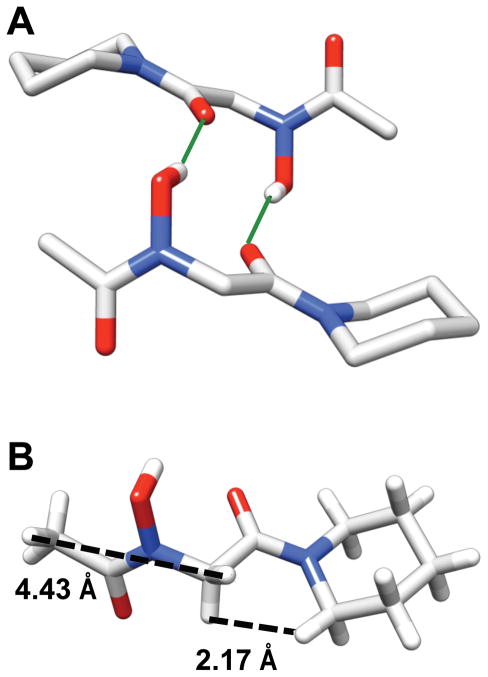
Figure 6.
Views of an X-ray crystal structure of peptoid 2. (A) Two molecules of 2 participating in an intermolecular hydrogen bond [solid green lines indicate the H-bonds; both intermolecular O • • • O distances = 2.071Å]. Hydrogens are omitted for clarity except for the amide side chain N-OH. (B) A single molecule of 2 illustrating the intramolecular distances between NT-H—ac1Hα and ac1Hα—CT-Hα protons [dashed black lines].

