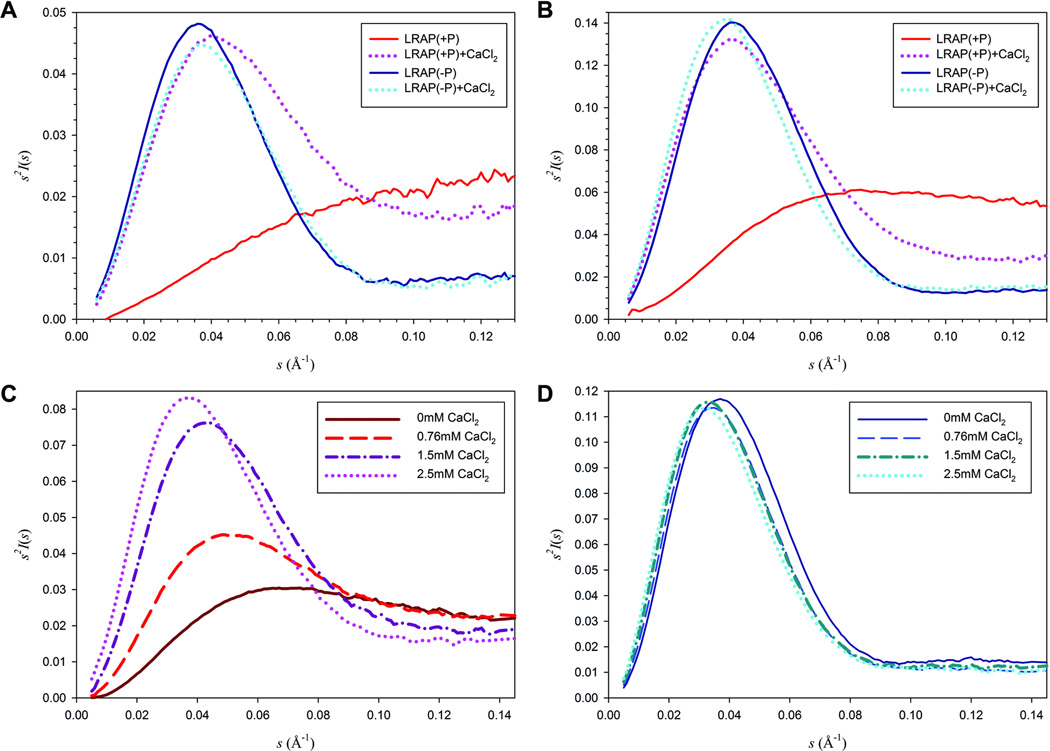
Figure 3. SAXS Analyses of LRAP(−P) and LRAP(+P).
Kratky plots of LRAP(−P) and LRAP(+P) at 2 mg/mL (A) and 5 mg/mL (B ,C and D) were determined in the absence and in the presence of 2.5 mM CaCl2 (A and B) and from 0 to 2.5 mM CaCl2 (C and D). The plots of LRAP(−P) in the absence and presence of calcium showed a similar bell-shaped curve indicating globular structures (A, B and D). However, in the absence of calcium (A and B), LRAP(+P) showed a plateau indicating an unfolded structure, whereas a prominent peak appeared upon addition of 2.5 mM calcium (A and B). This latter peak was found to become increasingly more pronounced as a function of calcium concentration (C), suggesting the formation of a more globular LRAP(+P) structure in the presence of added calcium.

