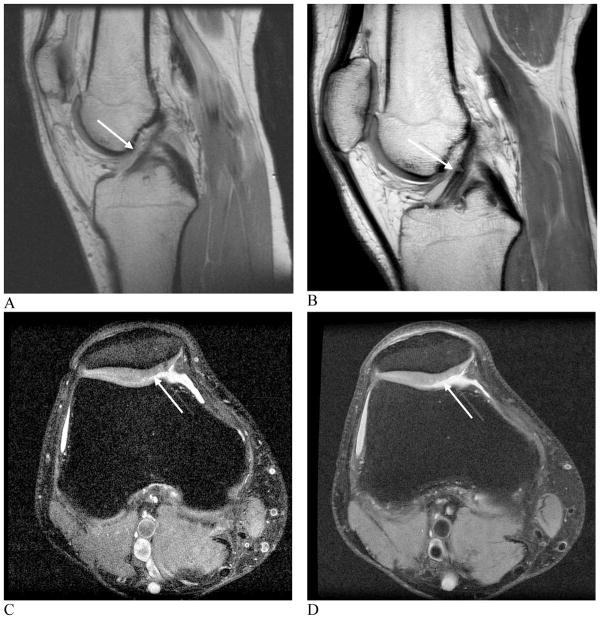
Figure 1. Images showing comparison between 1.5 and 3.0 T field imaging.
A and B, sagittal proton density-weighted images at 1.5 T (A) and 3.0 T (B) of a healthy anterior cruciate ligament. C and D, axial, fast spin echo images at 1.5 T (C) and 3.0 T (D) of a cartilage lesion. Better visualization of the anterior cruciate ligament and cartilage legion is possible at 3.0 T when compared with 1.5 T due to increased SNR (arrows, A, B, C, D).
(Images A and B reproduced with permission of the Seminars in Roentgenology. Images C and D courtesy of S. Reeder, University of Wisconsin -Madison).

