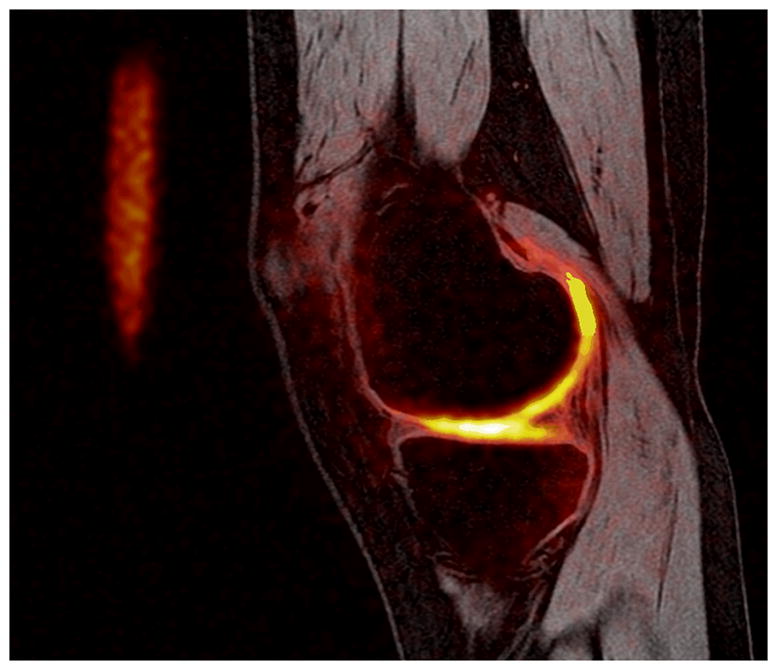
Figure 10. Image acquired in a healthy volunteer at 3.0 T.

Proton image (spoiled gradient echo) with a sodium image overlay (heat scale). Sodium imaging has the capability to display proteoglycan content; focal areas in which sodium concentration is reduced indicate a decreased proteoglycan content.
