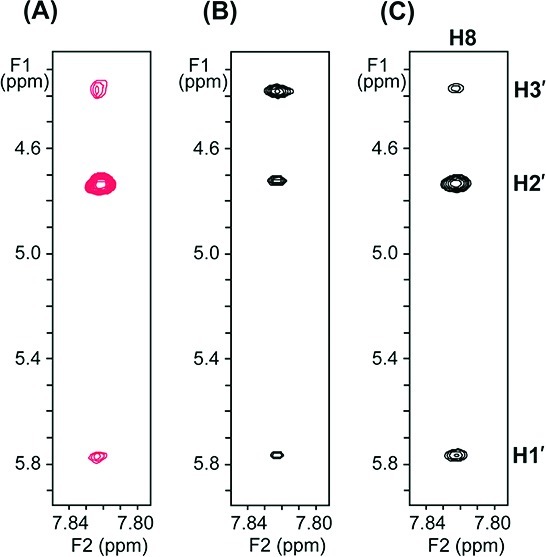
Figure 2.

Expanded views of the spectral region covering NOEs between base proton H8 and sugar protons H1′, H2′, and H3′ of monomeric ImpG in D2O with 100 mM NaCl and 10 mM phosphate buffer (pH 7.8) at 4 °C. (A) NOESY spectrum (mixing time, 600 ms) of 10 mM ImpG in the absence of single-stranded template. (B) TrNOESY spectrum (mixing time, 100 ms) of 8 mM ImpG in the presence of an RNA single-stranded template (0.5 mM strand concentration). (C) TrNOESY spectrum (mixing time, 100 ms) of 9 mM ImpG in the presence of a DNA single-stranded template (0.6 mM strand concentration). The red cross-peaks in (A) correspond to positive NOEs having the opposite sign as the diagonal peaks; the black cross-peaks in (B) and (C) correspond to negative NOEs having the same sign as the diagonal peaks.
