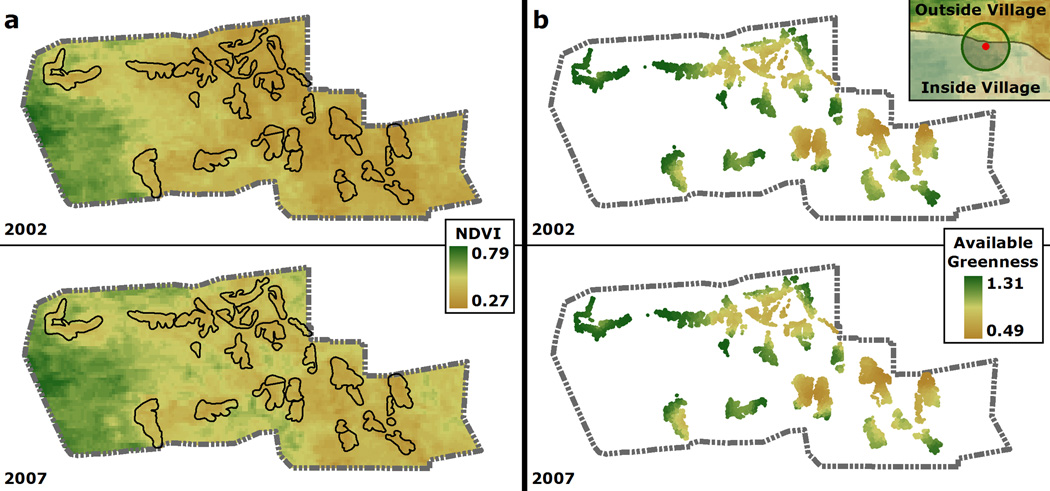
Figure 2.
Mean relative greenness for periods leading up to 2002 and 2007, for (a) the Agincourt study area; (b) extracted within household collection zones (displayed at household level within the original village polygons). Inset (b) shows an example of how natural resource availability was calculated for each household.

