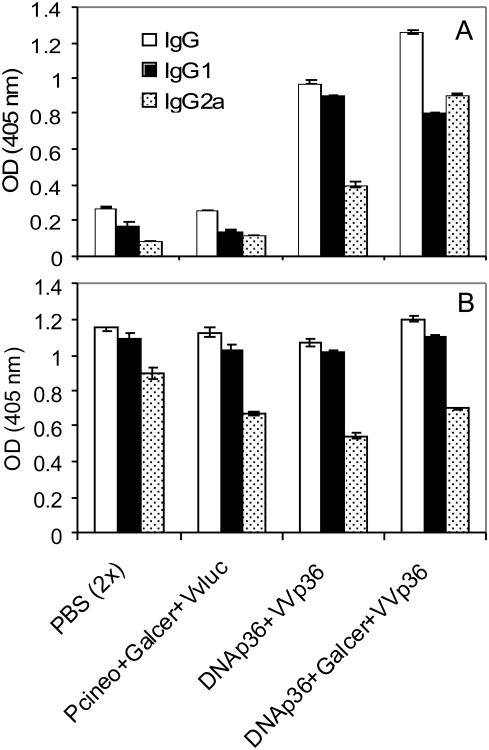
Figure 3. Antibody Responses of Vaccinated Mice.
The antibody responses of the vaccinated and control mice were evaluated at 13 weeks post-infection against: A) LACK antigen (1:500) and B) SLA (whole leishmanial lysate; 1:1000). The levels of total IgG as well as specific IgG1 and IgG2 were determined as indicated in Materials and Methods Section. The antibody responses of mice receiving αGalCer+DNAp36 versus DNAp36were significantly different for: LACK: Total IgG (p=0.0001); IgG1 (p=0.04); IgG2a (p=0.00001); SLA: Total IgG (p=0.03); IgG2a (p=0.01); IgG1 (not significant). These results are representative of 3 independent experiments.

