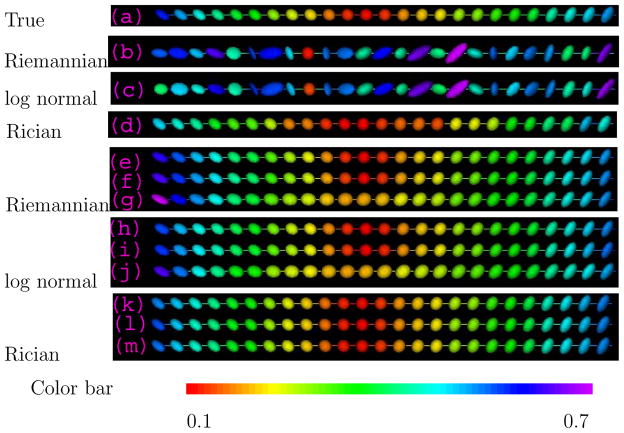
Fig. 2.
Ellipsoidal representations of (a) the true SPD matrix data along the design points; simulated SPD matrix data along the design points under the three different noise models: (b) Riemannian log normal, (c) log normal and (d) Rician noise models; and estimated SPD matrix data along the design points using three smoothing methods: (e), (h) and (k): ILPR under the trace metric; (f), (i) and (l): ILPR under the Log-Euclidean metric; and (g), (j) and (m): LPR under the Euclidean metric; and under the three different noise models: (e)–(g): Riemannian log normal model; (h)–(j): log normal model; and (k)–(m): Rician noise model, colored with FA values defined in (37).

