Fig. 6.

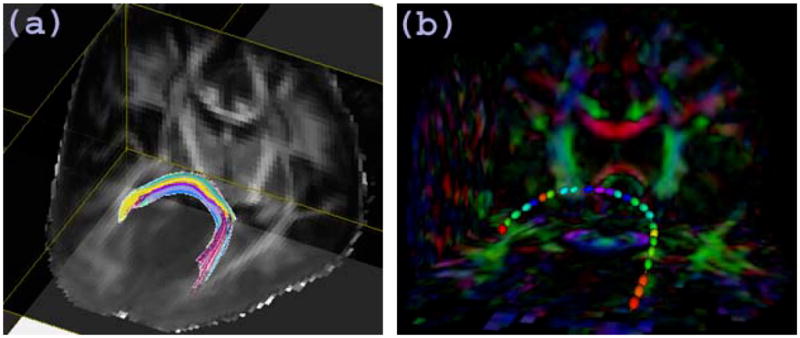
(a)The splenium of the corpus callosum in the analysis of HIV DTI data. (b)The ellipsoidal representation of full tensors colored with FA values on the fiber tract from a selected subject.

(a)The splenium of the corpus callosum in the analysis of HIV DTI data. (b)The ellipsoidal representation of full tensors colored with FA values on the fiber tract from a selected subject.