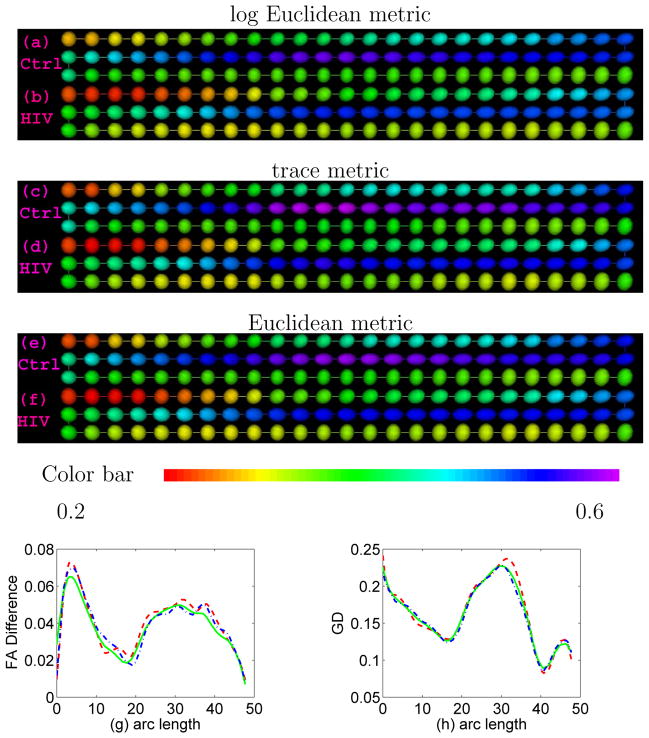
Fig. 8.
Ellipsoidal representations of estimated mean tensors along the splenium of the corpus callosum for the control and HIV groups using the intrinsic local linear regression under the Log-Euclidean ((a) and (b)), trace ((c) and (d)) and Euclidean ((e) and (f)) metrics colored with FA values. Each set of 3 rows in (a)–(d) represents one tract of tensors and the three rows are read from left to right in the top row, right to left in the middle row and then left to right in the bottom row. (g) FA differences and (h) geodesic distances (GD) between the mean diffusion tensors of HIV and control groups along the splenium of the corpus callosum under the Log-Euclidean (the solid line), trace (the dashed line) and Euclidean (dash-dot line) metrics.

