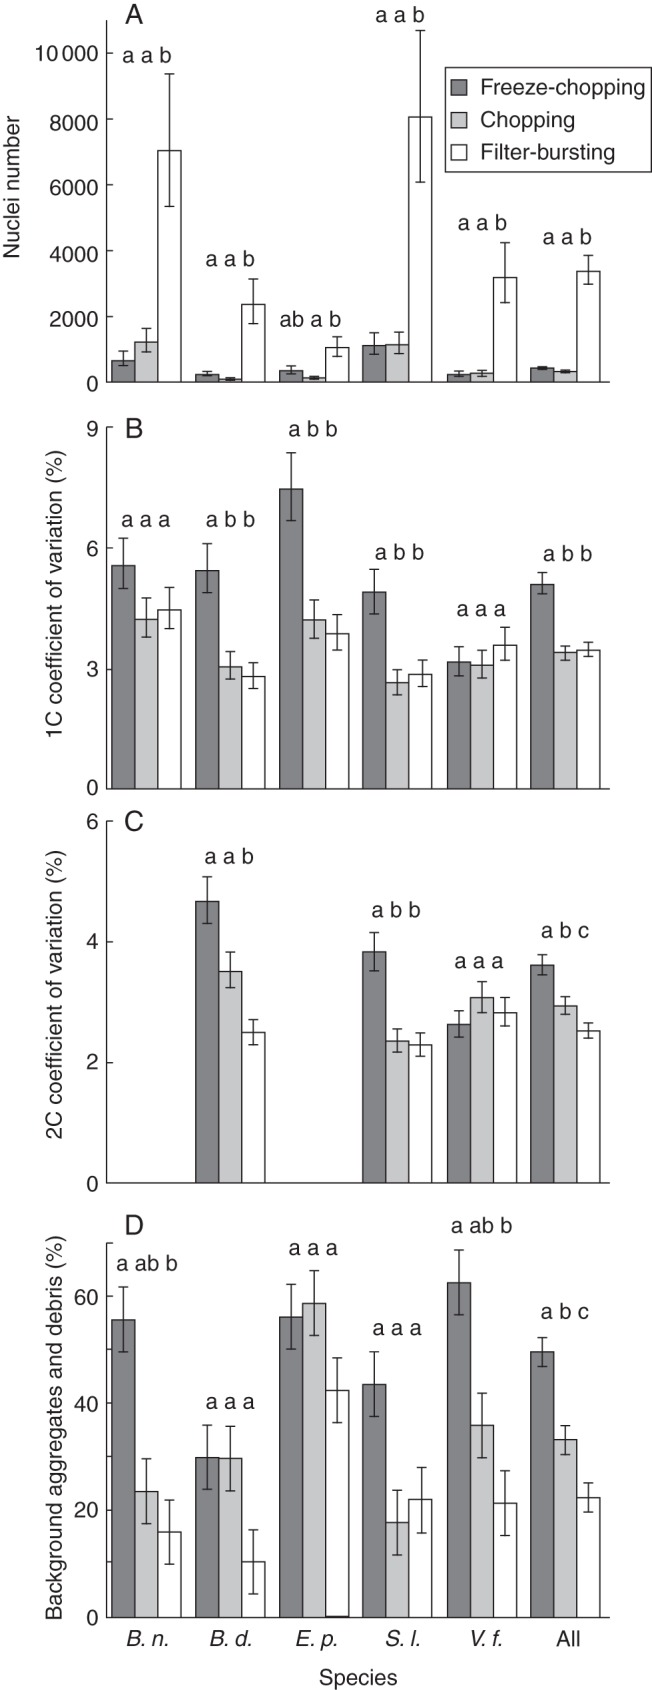
Fig. 2.

Comparison of sample quality measures for three nuclei extraction treatments: freeze-chopping (dark grey), chopping (light grey) and filter-bursting (white). (A) Total pollen nuclei number across all peaks; (B) CV of 1C pollen peak; (C) CV of 2C (generative) nuclei peak (binucleate species only); (D) BAD. All values shown are least-square means with s.e. from the ANOVAs in Table 3. Bars marked by the same lower-case letter indicate values not significantly different within a species (Tukey's HSD, α = 0·05), but do not have meaning across species. ‘All’ = main treatment effect across all species; B. n. = Brassica napus; Z. m. = Zea mays; E. p = Eupatorium perfoliatum; B. d. = Buddleia davidii; S. l. = Solanum lycopersicum; V. f. = Vicia faba.
