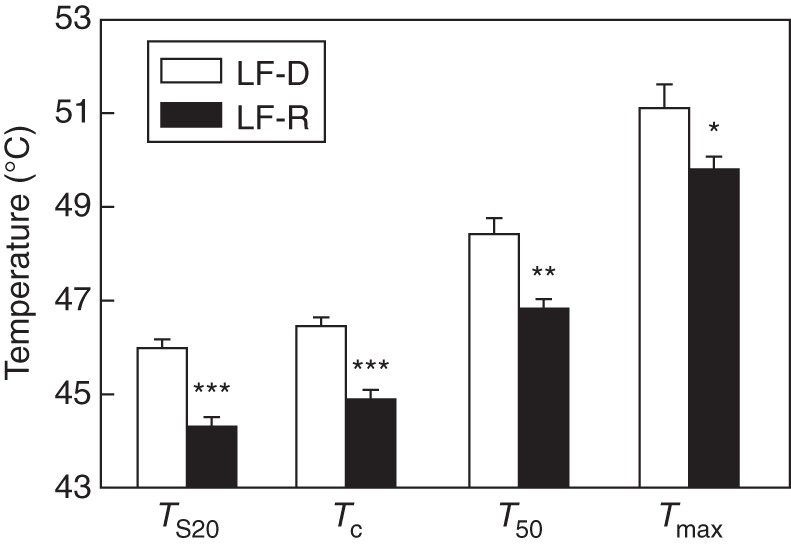
Fig. 3.

Differences in TS20, Tc, T50 and Tmax between species with leaf flushing in the late dry season (LF-D, n = 5) and species with leaf flushing in the rainy season (LF-R, n = 19). See Fig. 2 for definitions of the four photosynthetic thermotolerance parameters. Data are means ± s.e. *P < 0·05; **P < 0·05; ***P < 0·001.
