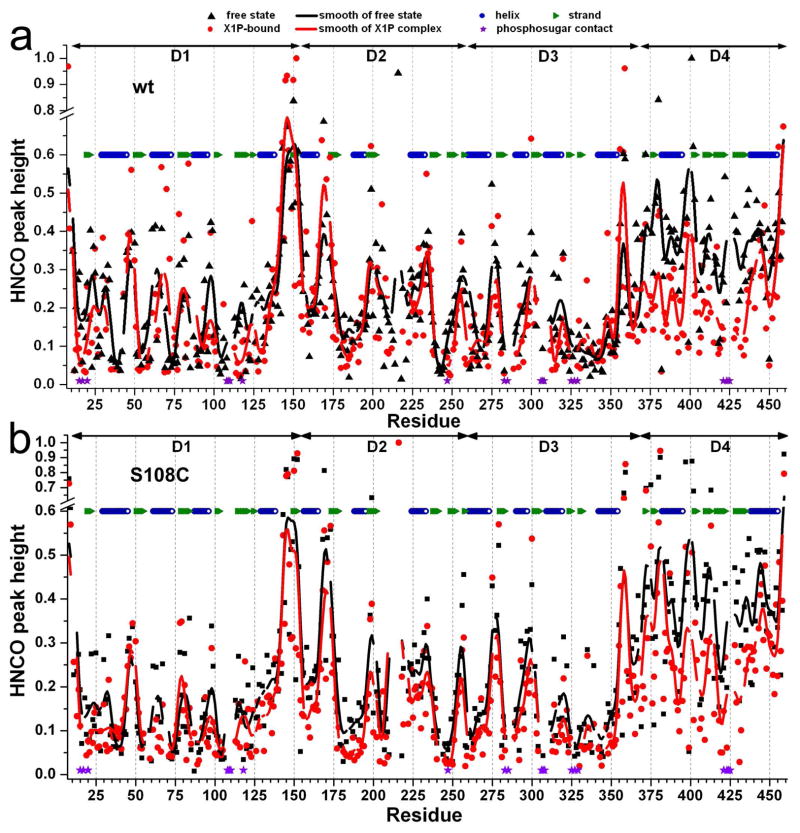
Figure 6.
NMR evidence of mobility of D4 and loops. Peak heights of TROSY-enhanced HNCO spectra, normalized to the tallest peaks, are plotted for wt PMM/PGM (a) or PMM/PGM(S108C) (b), both before (black) and after saturating addition of X1P to 5-fold molar excess (red). Domain boundaries are marked at top. Curves indicate smoothing by 3-point fast Fourier transformation that filtered out extremes in peak heights. Sequence positions that contact phosphosugars are marked by purple stars.

