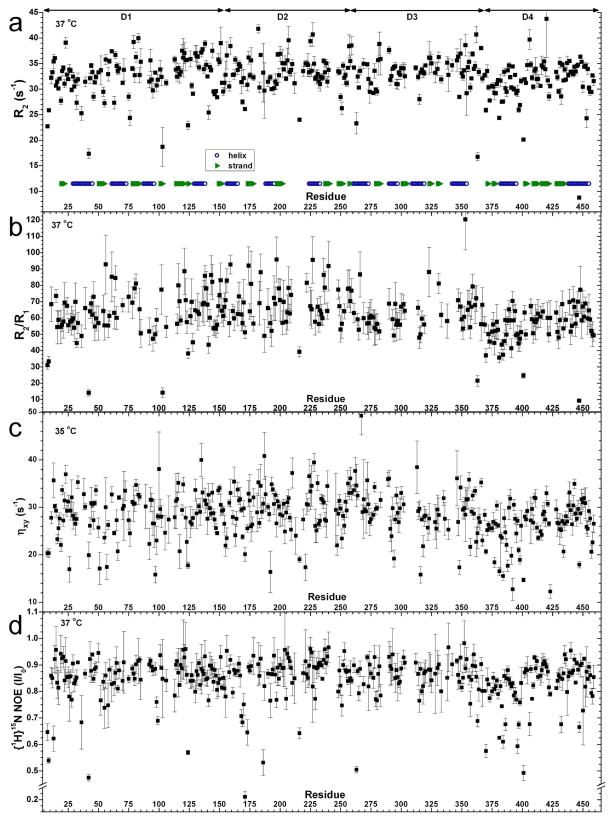
Figure 7.
15N relaxation of wt PMM/PGM collected at 800 MHz. Shown are R2 = 1/T2 in (a), R2/R1 in (b), transverse cross-correlation rate ηxy in (c), and {1H}15N steady-state NOE difference plotted as Isaturated/Inon-saturated in (d). The uncertainties in (a–c) are errors in fitting. The uncertainties in (d) are the standard deviations of triplicate measurements.

