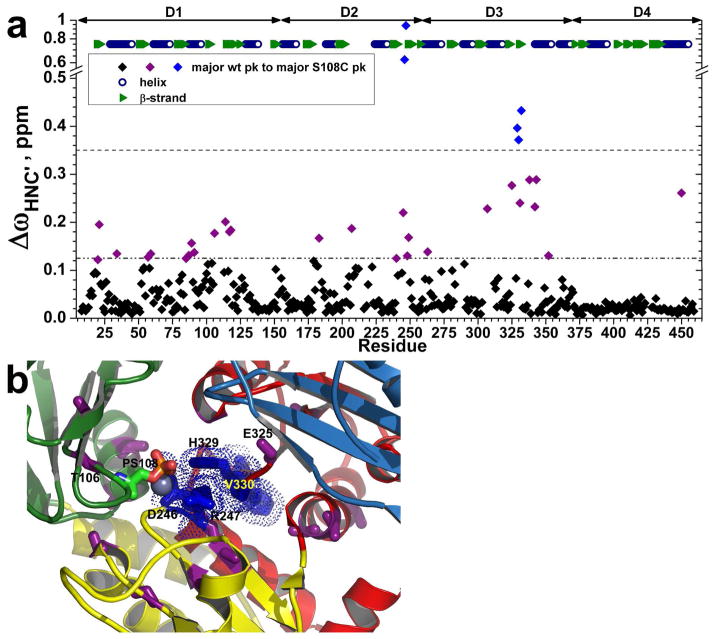
Figure 9.
Chemical shift perturbations by the S108C mutation. (a) Radial chemical shift changes, calculated as ΔωHNC′ = ((ΔωHn)2 + (ΔωN/6)2 + (ΔωC′/2.4)2)1/2, are plotted for each residue’s main amide peak in PMM/PGM(S108C) relative to the main peak of wt enzyme. The peak positions were measured from TROSY-HNCO spectra (800 MHz, 37°C, and pH 7.4). The larger changes between major peaks in wt and S108C variants are marked on the crystal structure (1K35.pdb) in (b). Residues with ΔωHNC′ > 0.35 ppm are blue with side chains plotted in (b). Residues with 0.35 > ΔωHNC′ > 0.125 ppm are purple with side chains plotted in (b). Domains 1 through 4 are green, yellow, red, and sky blue in succession. PhosphoSer108 is colored by atom type.

