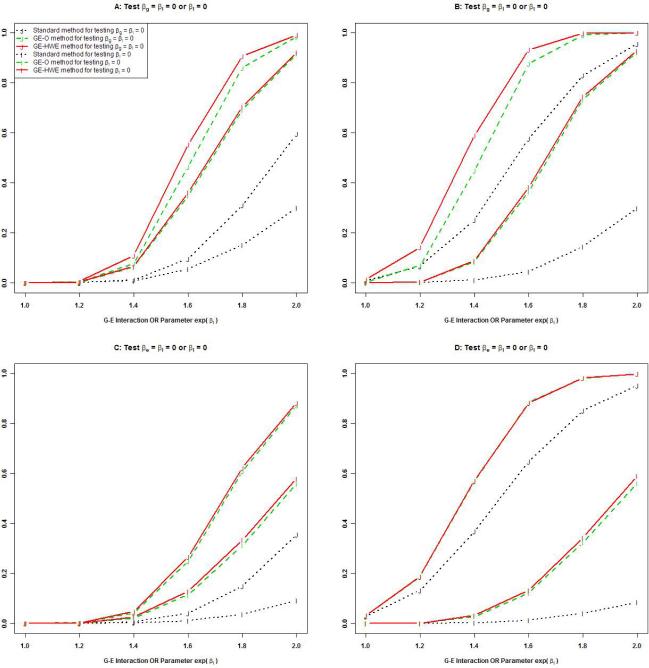
Figure 1.
Power of the three methods under the standard case-control design. Panels A and B display the power for testing βI = 0 or βg = βI = 0 in the absence (panel A) or presence (panel B) of the genetic main effect (eβg = 1.2). Other parameters included pe = 0.3, pa = 0.3, and eβI = 1.5. Each of the 1,000 replicates included 500 cases and 500 controls. Panels C and D display the power for testing βI = 0 or βe = βI = 0 in the absence (panel C) or presence (panel D) of the environmental main effect (eβe = 1.5). Other parameters included pe = 0.3, pa = 0.3, and eβg = 1.2. Each of the 1,000 replicates included 300 cases and 300 controls. The size of the test was set at 0.0001.

