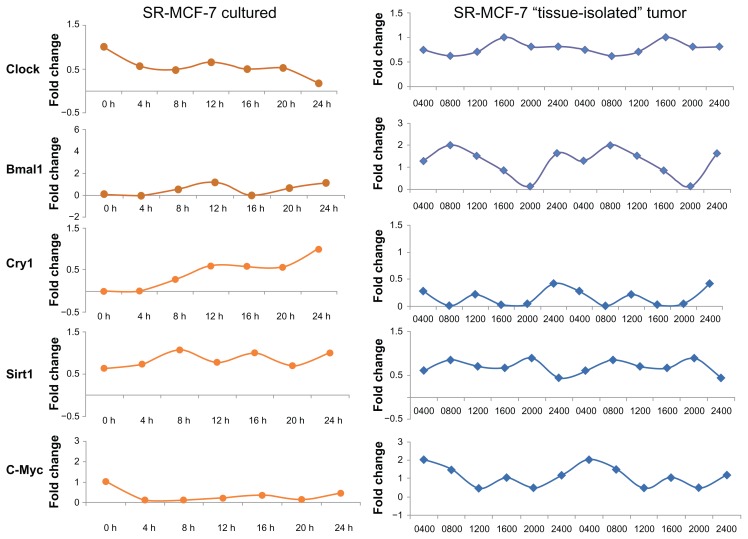
Figure 6.
Oscillation profiles of clock genes and CCGs in SR- MCF-7 cells grown in normal culture media or as “tissue-isolated” xenografts in circadian intact athymic nude female rats. (A) SR- MCF-7 cells were grown 4 days to confluence, the medium was exchanged with fresh medium (RPMI-1640 supplemented with 10% FBS) and after 2 h this medium was replaced with serum-free medium. At the indicated times, cells were washed and collected. RNA was extracted and qPCR was performed to measure gene expression. GAPDH served as an internal control. Clock gene expression was standardized on the basis of GAPDH expression, and the relative level of each clock gene is plotted in the graph. (B) Adult female nude rats bearing “tissue-isolated” human SR- MCF-7 cancer xenografts were maintained on either a control 12L (345 lux; 141.5 μW/cm2):12D photoperiod as previously described.17
Notes: When tumors reached an estimated weight of 5–6 g, animals were sacrificed at 6 circadian time-points over a 24-hr period (beginning at 0400 hrs; n = 6/timepoint) and tumors were freeze-clamped and stored at −80 −C for analysis of mRNA levels of the Clock genes Bmal1, Clock, Cry1 and the clock-associated genes Sirt1 and cMyc.

