
Figure 7 .
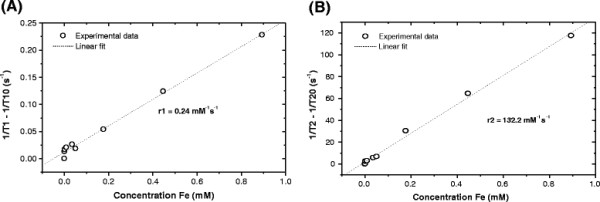
Longitudinal (A) and transverse (B) relaxation rates as a function of concentration of Fe in HNPs. The dotted line represents the linear fit to the experimental data. The relaxivities r1 and r2 were calculated as the gradient to the straight lines fitted to the experimental data.