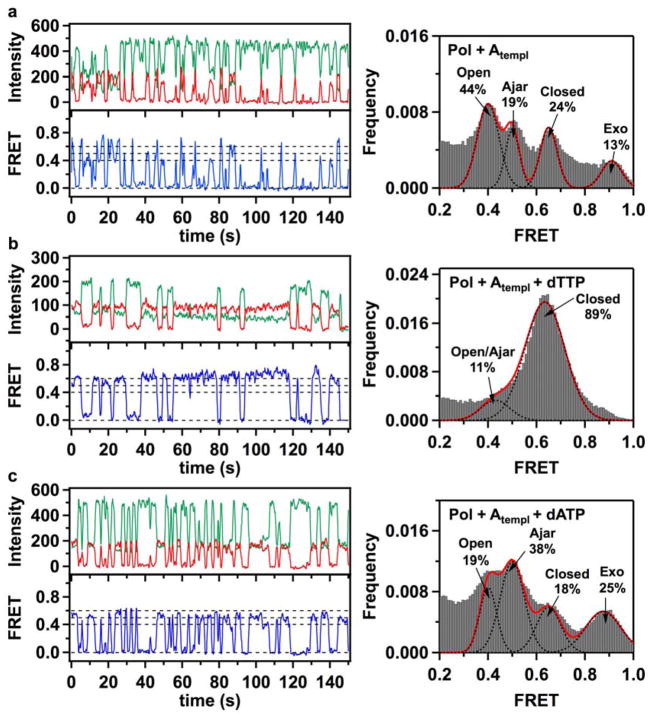
Figure 2. Fluorescence intensity time traces, smFRET efficiency trajectories and FRET efficiency histograms for finger-labeled polymerase molecules (L744C KF).
(a) Binary Pol+Atempl complexes, formed by binding of acceptor-labeled L744C KF molecules to donor-labeled DNA molecules with A in the template extension position, show fast sampling of three bound states, with mean FRET efficiencies of 0.41, 0.50 and 0.63. A small fraction of complexes populate a separated 0.90 FRET state. The assignment of the individual peaks to open, ajar and closed conformations of the fingers subdomain, and to a population of DNA bound at the 3′-5′ exonuclease (exo) site, are discussed in the text. (b) Correct ternary Pol+Atempl+dTTP complexes, formed in the presence of 1 mM dTTP in the solution, show stable binding in the 0.63 FRET state (left). Two separate peaks in the lower FRET region are not resolved and appear as a shoulder at 0.45 FRET, while a higher 0.9 FRET state is no longer apparent (right). (c) In the presence of 1 mM incorrect dATP nucleotides, Pol I KF frequently samples short-lived 0.4 and 0.5 FRET states, with decreased number of molecules in the 0.63 FRET state. The number of complexes populating the 0.9 FRET state increases. In all cases, the green and red traces show background corrected fluorescence intensities in the donor and acceptor channels, respectively. The blue lines show corresponding smFRET trajectories. The dashed lines positioned at 0, 0.4, 0.5 and 0.6 FRET efficiencies are for ease of visual inspection. Histograms of smFRET efficiencies compiled from multiple trajectories (right) were fitted using multiple Gaussian functions. Dashed black lines show individual Gaussian fits, with the red line corresponding to a composite sum of Gaussians. The percentage numbers on each graph indicate the fraction of complexes in different populations, obtained from the peak areas of the Gaussian fits. The numbers of individual smFRET time trajectories used to construct each histogram were 320 (a), 244 (b) and 299 (c).

