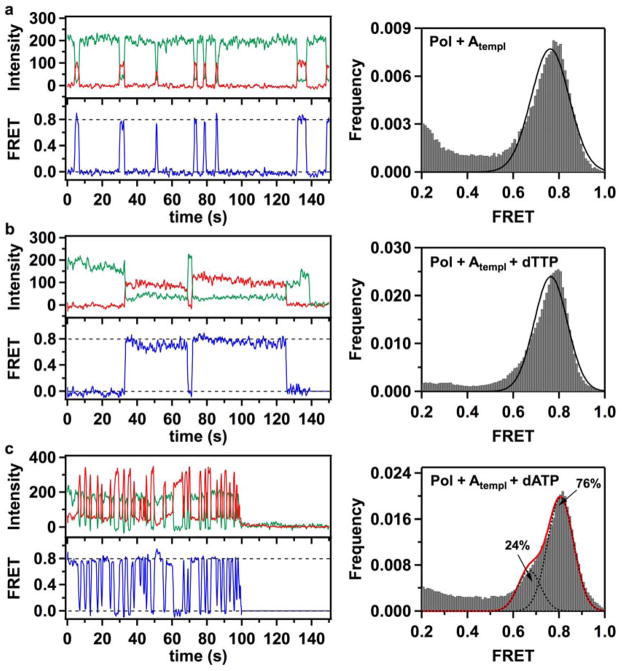
Figure 3. Fluorescence time traces, smFRET efficiency trajectories and FRET efficiency histograms for thumb-labeled polymerase molecules (K550C KF).
(a) Binding events of acceptor-labeled K550C KF polymerases to immobilized donor-labeled DNA molecules produced short-lived FRET bursts. A composite FRET efficiency histogram compiled from 228 trajectories shows that binary Pol+Atempl complexes populate a single 0.78 FRET state, in contrast with the three-state behavior of L744C KF. (b) Correct Pol+Atempl+dTTP complexes formed in the presence of 1 mM dTTP in the solution demonstrate that K550C molecules exhibit a prolonged period (exceeding 5 s) in a 0.80 FRET state. The composite histogram is compiled from 208 trajectories. (c) In the presence of 1 mM incorrect dATP nucleotides, K550C KF demonstrates frequent sampling of a 0.81 FRET state, reflecting formation of unstable incorrect ternary Pol+Atempl+dATP complexes. The FRET efficiency histogram (compiled from 228 trajectories) also reveals a sub-population (24%) of complexes captured in a 0.7 FRET state. In all cases, the green, red and blue traces correspond to the donor intensity, acceptor intensity and corresponding FRET efficiency trajectories, respectively. The dashed lines positioned at 0 and 0.8 FRET efficiencies are for ease of visual inspection. Gaussian fits to the histogram peaks are shown as black lines. The red line in panel c represents a composite sum of the two fitted Gaussian peaks.

