
Fig. 2.
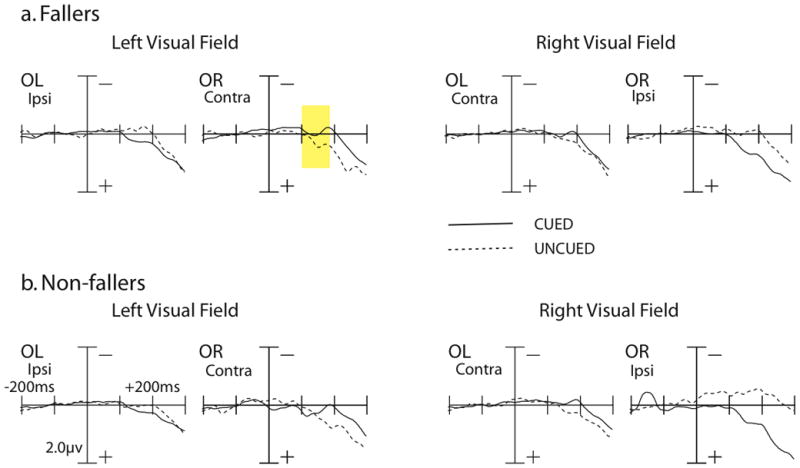
Grand-averaged ERP responses to targets for the P1 and N1 time windows. Data are shown as a function of visual field (left vs. right) and cueing (cued vs. uncued) for fallers (top) and non-fallers (bottom). Time window is out to 300 ms post-cue, with a 200 ms pre-cue baseline. Amplitude measured in uV. For the P1 component, fallers showed a larger amplitude for uncued trials relative to cued trials in the left visual field for contralateral sites (highlighted in yellow). In contrast, non-fallers showed a larger P1 amplitude for cued trials relative to uncued trials. There were no significant differences between fallers and non-fallers for the N1 component.