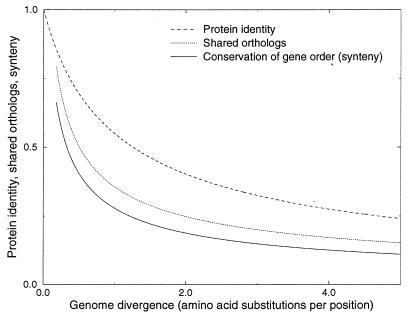
Figure 6.
Relative rates of genome evolution. The curves were fitted from the fraction of shared orthologs (Fig. 2) and the conservation of the order of genes (Fig. 3), the curve that shows the relationship between protein identity and the number of amino acid substitutions per position according to Grishin’s equation (Fig. 2), was added for comparison. Intergenic regions are even less conserved than the order of genes. Nonorthologous gene displacement indicates that metabolism is more conserved than the fraction of shared orthologous genes.

