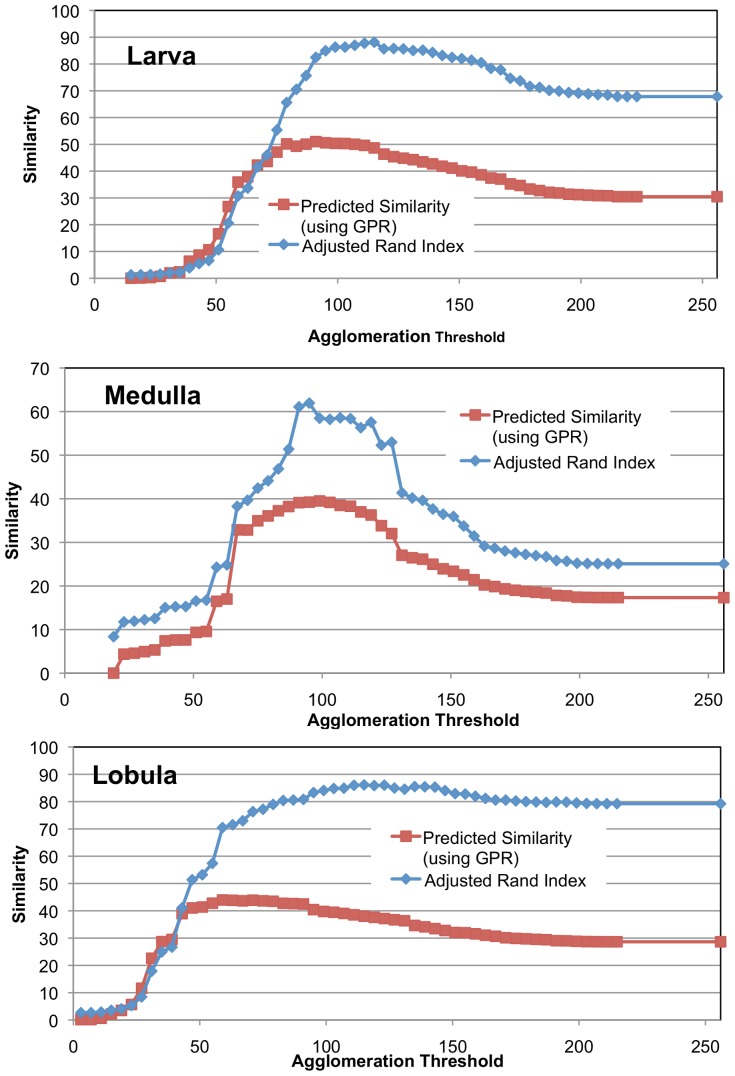
Figure 7. Shows the predictiveness of GPR similarity measure compared to the actual adjusted Rand index computed with an expert-created ground truth.
The y-axis gives similarity as a function of different agglomeration thresholds. The agglomeration is based on the mean intensity of the pixel-wise boundary prediction.

