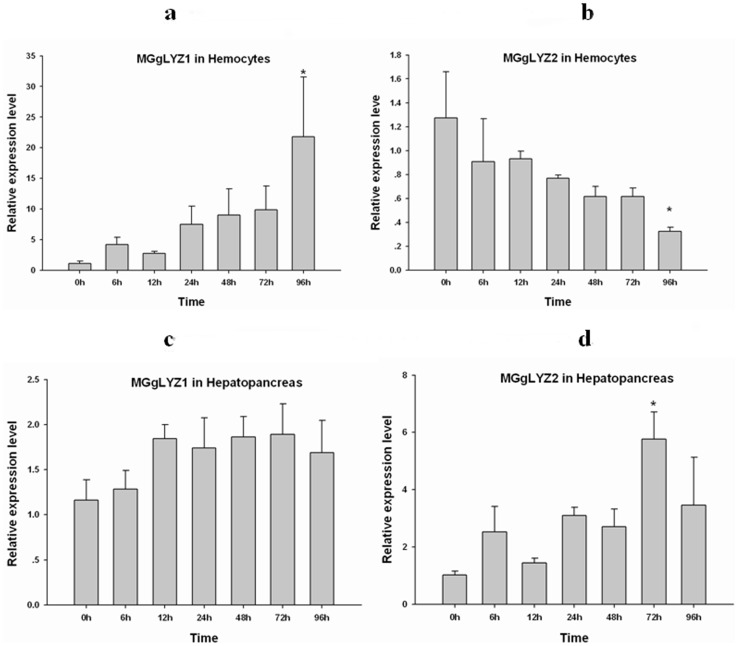
Figure 6. Temporal expression profiles of gLYZ mRNAs in hemocytes (a-MGgLYZ1, b-MGgLYZ2) and hepatopancreas (c-MGgLYZ1, d-MGgLYZ2) after bacterial challenge.
The mRNA expression level is calculated relative to actin expression and shown as mean ± SD (n = 4). Significant difference from control (0 h) is indicated with an asterisk at P<0.05.

