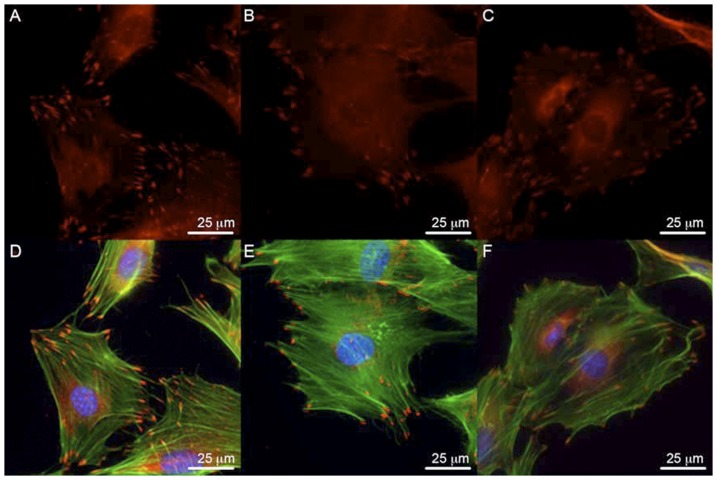
Figure 2. Paxillin expression and localization in osteoblasts.
(A–C) Paxillin expression in MC3T3 osteoblasts, FAK+/+ osteoblasts and FAK−/− osteoblasts is similar. (D–F) Overlay of paxillin (red) and F-actin (green) as shown by phalloidin staining shows regions of strong paxillin expression and localization corresponding to the termini of actin fibers. FAK−/− cells exhibited fewer numbers of focal adhesions per cell area as quantified by point counting. DAPI nuclei stain in blue. Magnification = 60×. Scale bar represents 25 µm.

