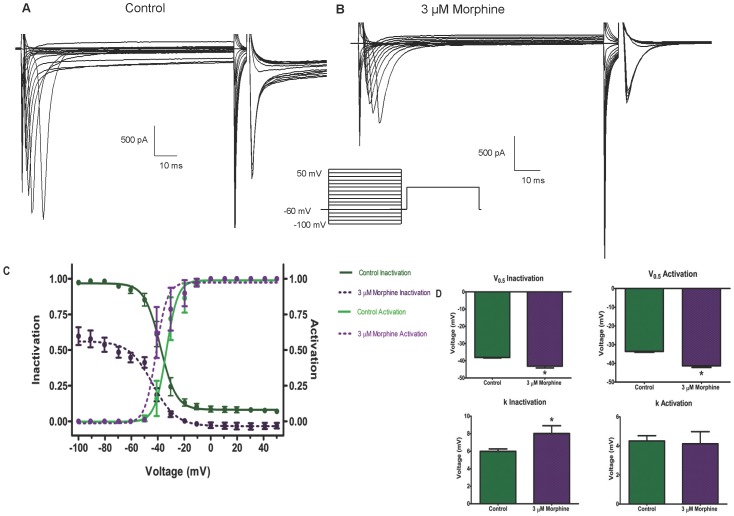
Figure 9. Morphine alters the inactivation and activation kinetics of Na+ channels.
Na+ channel inactivation was examined using a double-pulse protocol without drug (A) and in the presence of 3 µM morphine (B). Boltzmann curve analysis (C) of inactivation and activation kinetic of Na+ indicate a leftward shift for both curves in response to morphine, indicated by a significant difference in V0.5 values (D). The inactivation curve also experienced a downward shift due to morphine, indicated by a significant difference in k (D).

