
Figure 4. Waveform characteristics.
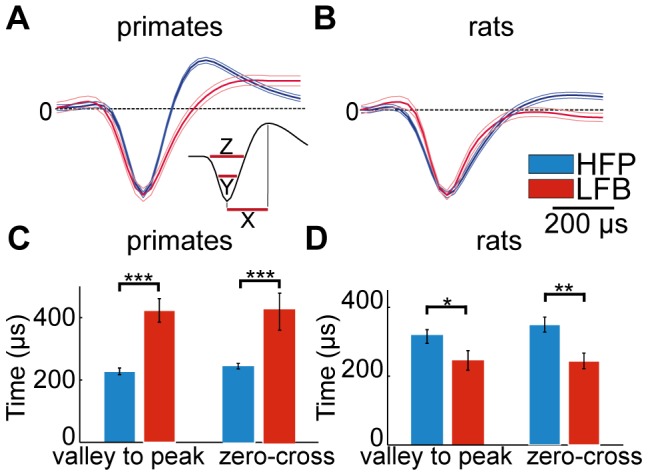
A and B: normalized average waveforms of HFP (blue) and LFB (red) neurons in primates (A) and rats (B). Inset: X represents the valley to peak duration, Y the valley width and Z the zero-cross parameter. C and D Bar plots representing waveform parameters in HFP (blue) and LFB (red) neurons in primates (C) and in rats (D).