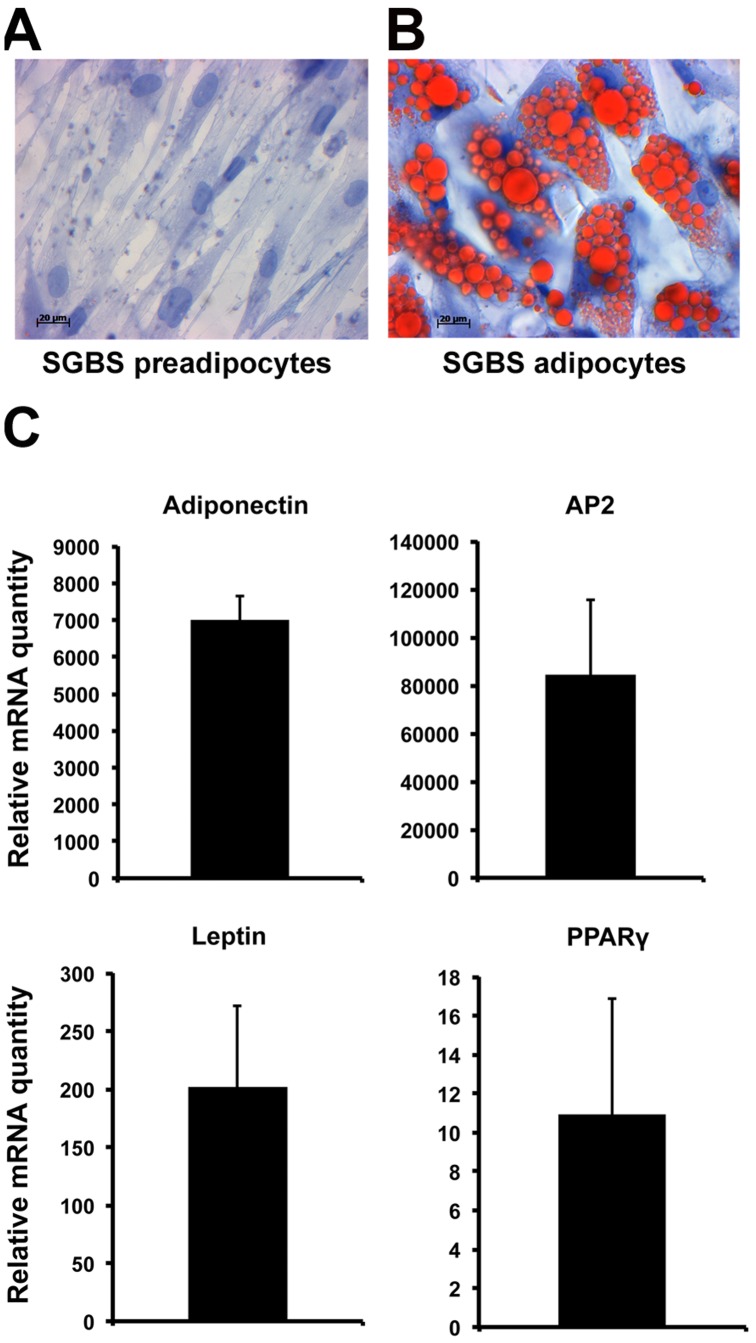
Figure 3. Adipogenic differentiation of SGBS cells.
Haematoxylin and Oil Red O staining of SGBS preadipocytes (A) and adipocytes differentiated for 22 days (B). C. Relative mRNA levels of the adipocyte differentiation markers adiponectin, aP2, leptin and PPARγ in SGBS adipocytes as compared to preadipocytes. The bars indicate fold-change, mean ± S.E. (n = 3).

