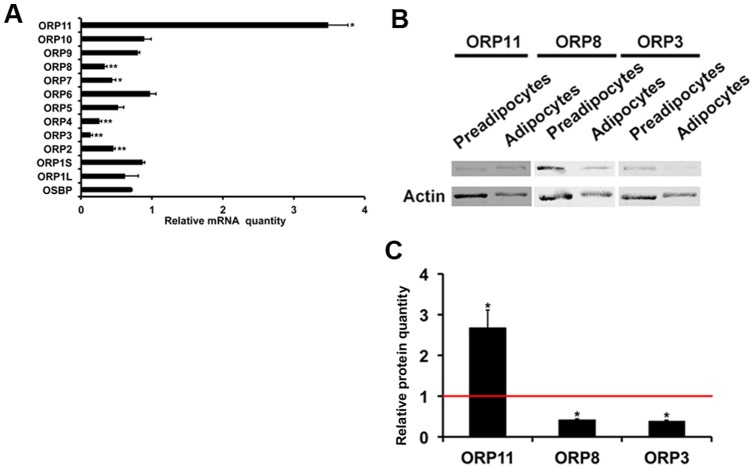
Figure 4. Changes in ORP mRNA and protein expression upon SGBS cell adipogenic differentiation.
A. Quantities of the indicated ORP mRNAs on day 22 of differentiation. The results are presented as fold change relative to preadipocytes. The data represents mean ± S.E., n = 3−4, *p<0.05, **p<0.01. B. Western blot analysis of the ORP11, ORP8, and ORP3 proteins in SGBS preadipocytes and adipocytes (day 22). C. Quantification of the Western data by densitometric analysis. The ORP11, ORP8 and ORP3 signals were normalized for that of β-actin. The data represents mean ± S.E., n = 3−4, *p<0.05.

