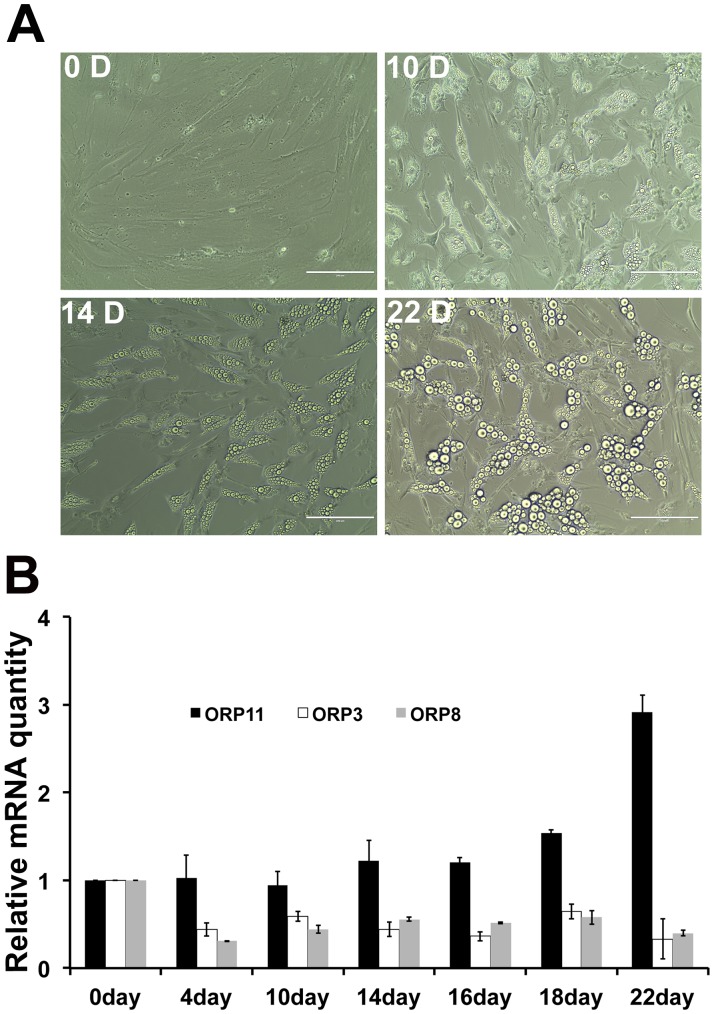
Figure 5. Time course of ORP11, ORP3, and ORP8 mRNA changes upon SGBS cell adipogenic differentiation.
A. Phase contrast images of SGBS preadipocytes (0 D) and differentiating adipocytes on days 10, 14, and 22. Bars, 200 µm. B. The ORP mRNA levels were quantified at the differentiation time points indicated, as fold changes relative to preadipocytes (day 0). The data represents mean ± S.E., n = 3.

