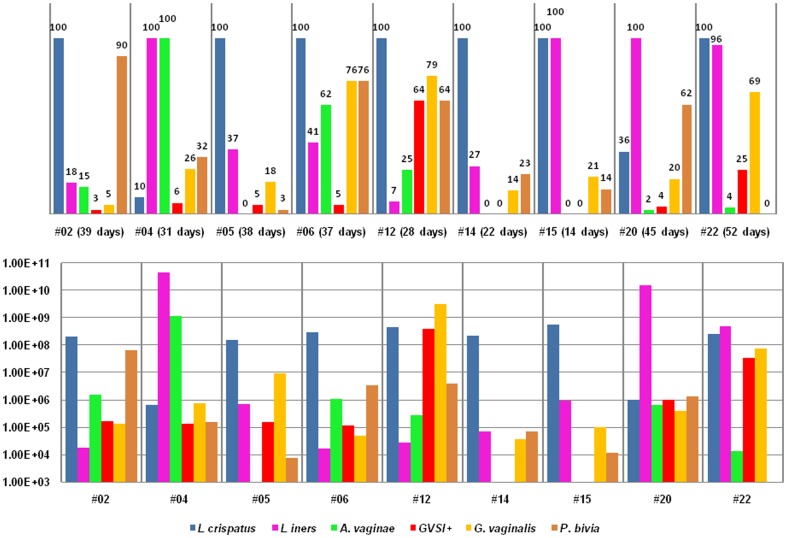
Figure 1. The presence and average concentrations of the 5 species during the study in group N.
Legend: The chart above represents the total presence (%) of the 5 species during the days that were analysed. In addition, the actual days present versus the total days analysed are also given. The chart below represents the average concentrations (cells/ml) of the 5 species during the days that were analysed.

