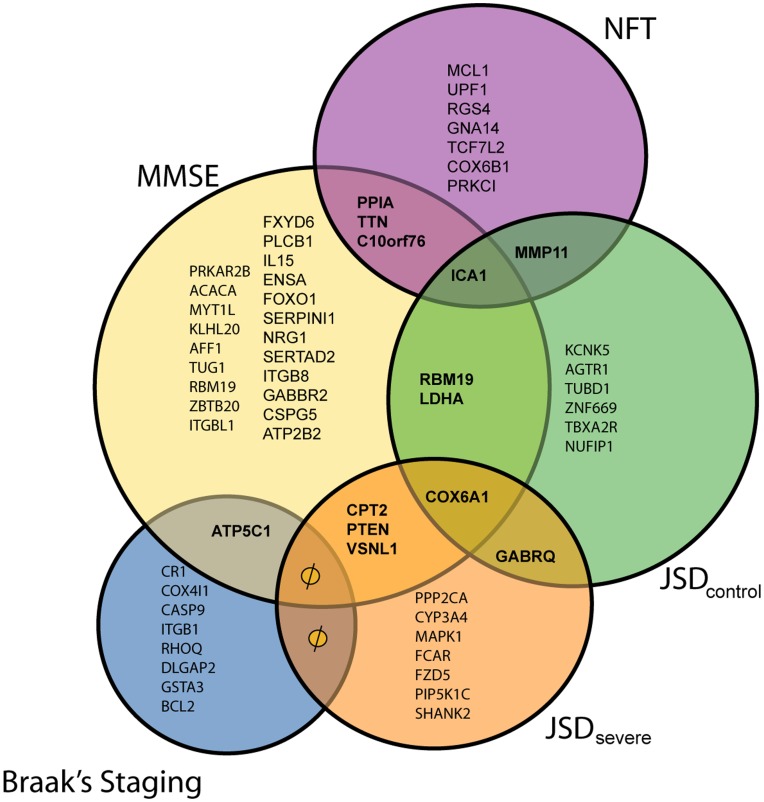
Figure 4. Venn diagram of the different transcripts clustered with progression markers in the 3,763,403 metafeatures data set.
This figure highlights the ‘robust correlating’ transcripts that are shared by different progression marker clusters. A null (φ) symbol here means that even if an overlap is shown in the figure, there is no common transcript. We refer the readers to Supporting Information Table S5., for further details of correlation of these markers to the phenotypes.

