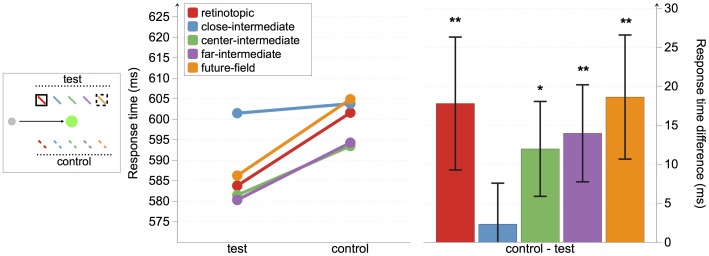
Figure 4. Experiment 1 response-time results.
The left panel depicts absolute response times for all conditions. The right panel shows the response time differences between test and control locations, with positive values indicating faster responses to targets at test than control locations. Error bars represent standard error. Asterisks indicate that differences are different from 0. *p<0.10; **p<0.05.

