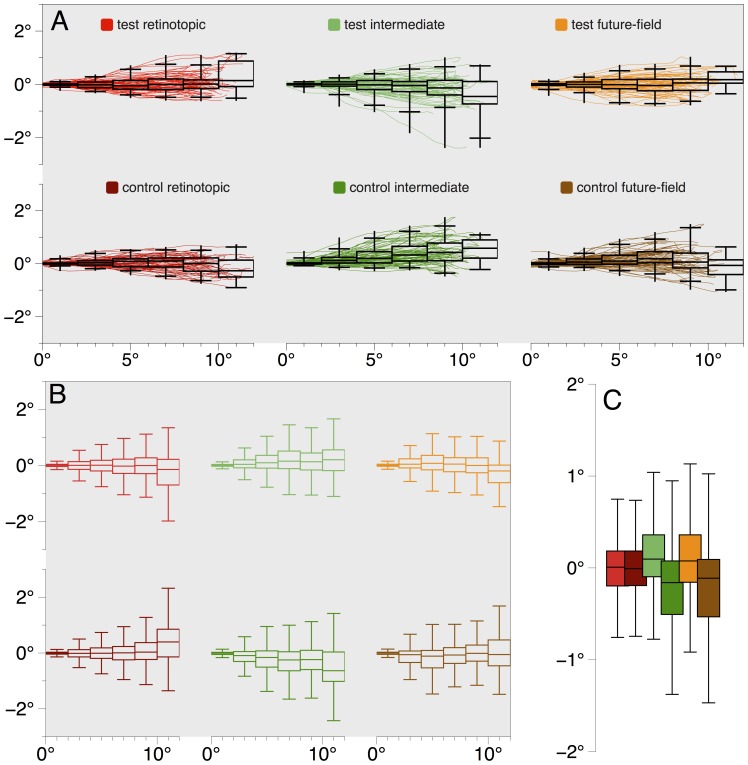
Figure 9. Experiment 2 saccade trajectories.
(A) Saccade trajectories for a single observer. All data were normalized to show all saccades as originating from the same position (0°, 0°) and as directed rightwards, and with the cue location above the saccade starting point. This normalization procedure would exaggerate any consistent trajectory patterns. Box and whisker plots show saccadic deviation across 2° bins, and reveal there was no consistent deviation in saccade trajectories across conditions for this observer. For each bin, the central band of a box represents the median deviation, the upper and lower bounds of the box represent the 25th and 75th percentiles, the extent of the whiskers show the range, and the whisker terminators indicate the 2.5th and 97.5th percentiles. As can be seen from the median deviations over the length of saccades, across conditions there is no consistent deviation toward or away from the cue location for this observer. (B) Box and whisker plots of saccade deviations for all observers in Experiment 2 revealed a lack of reliable deviation across conditions. Box plots are as described in (A). Whiskers show 1.5× interquartile range. The apparently high variability in saccade endpoints in the 10–12° bin likely arises from the low number of saccades that overshot the target at 9° (for example, see Figure 9A), and our normalization method described above. Any deviations from a direct line were small and non-significant. (C) To test if saccade trajectories were curved, we examined deviations at half the distance of the saccade length (4–6° bin shown in Figure 9B), when deviations should be greatest [16]. For each condition we found only small, non-significant deviations from zero and no differences across conditions. Condition colors in (B) and (C) correspond to those shown in (A).

