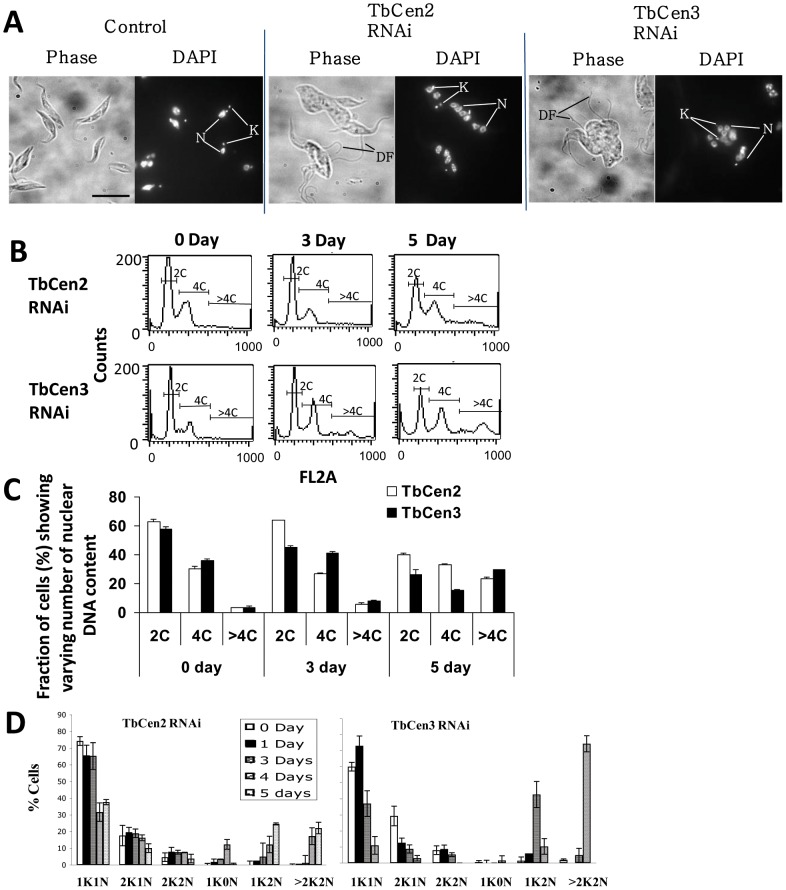
Figure 2. Analysis of cell structure and kinetoplasts and nuclei number in the RNAi cells.
A: DAPI-stained images of the control and TbCen2 and 3-depleted cells, 4d after RNAi induction. DF, detached flagella; K, kinetoplast; N, nucleus. Scale bar, 5 µm. (B & C) Fluorescence-activated cell sorting analysis for relative DNA content of TbCen2 and 3 depleted cells. B: Histogram plots of cell count by DNA content obtained directly from the flow cytometry analysis are shown. C: The percentage of cells that contain two times the DNA content (2C), four times (4C), and more than 4 times (>4C) were measured at each time point and are shown. Data represent the means ± SD of three independent experiments. D: Bar graph showing increase in the proportion of multinucleated and multikinetoplast cells with time after RNAi knockdown of TbCen2 and 3. Cells after different days of RNAi induction were stained with PI and examined by fluorescence microscope for tabulation of the cells with different number of kinetoplasts and nuclei. The time points at which the cells were analyzed after induction was up to day 5 for TbCen2 RNAi cells and day 4 for TbCen3 RNAi cells. Data represent the means ± SD of three independent experiments. For each TbCen2 and 3 RNAi studies, over 140 cells were manually counted and analyzed.

