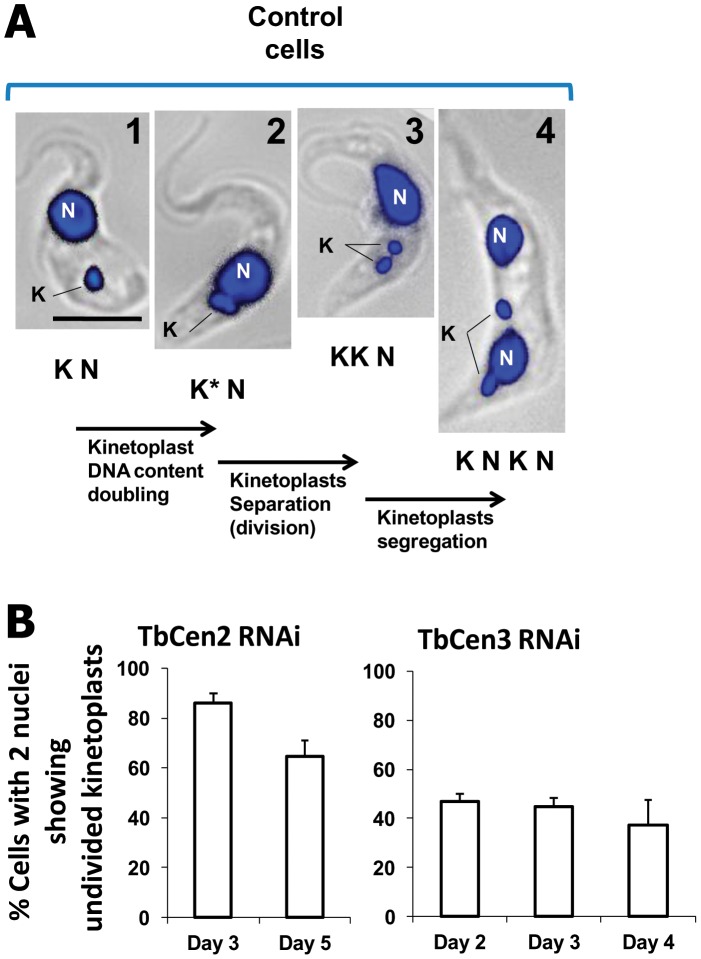
Figure 5. Sequence of organelle biogenesis and segregation in normal and RNAi cells.
A: The control cells sequentially show duplication of DNA content from panel 1 to 2; division into two kinetoplasts from panel 2 to 3; segregation of the separated kinetoplasts to appropriate locations from panel 3 to 4. An, anterior end; K, kinetoplast; N, nucleus, Po, posterior end. Scale bar, 5 µm. B: Histogram showing the percent of TbCen2 and TbCen3 RNAi cells with undivided kinetoplasts in the two nucleated cells at different time points including day 3 for TbCen2 RNAi and day 2 for TbCen3 RNAi. For the TbCen2 and 3 RNAi, average 200 and 170 cells respectively were manually counted and analyzed during each time point. Data represent the means ± SD of three independent experiments.

