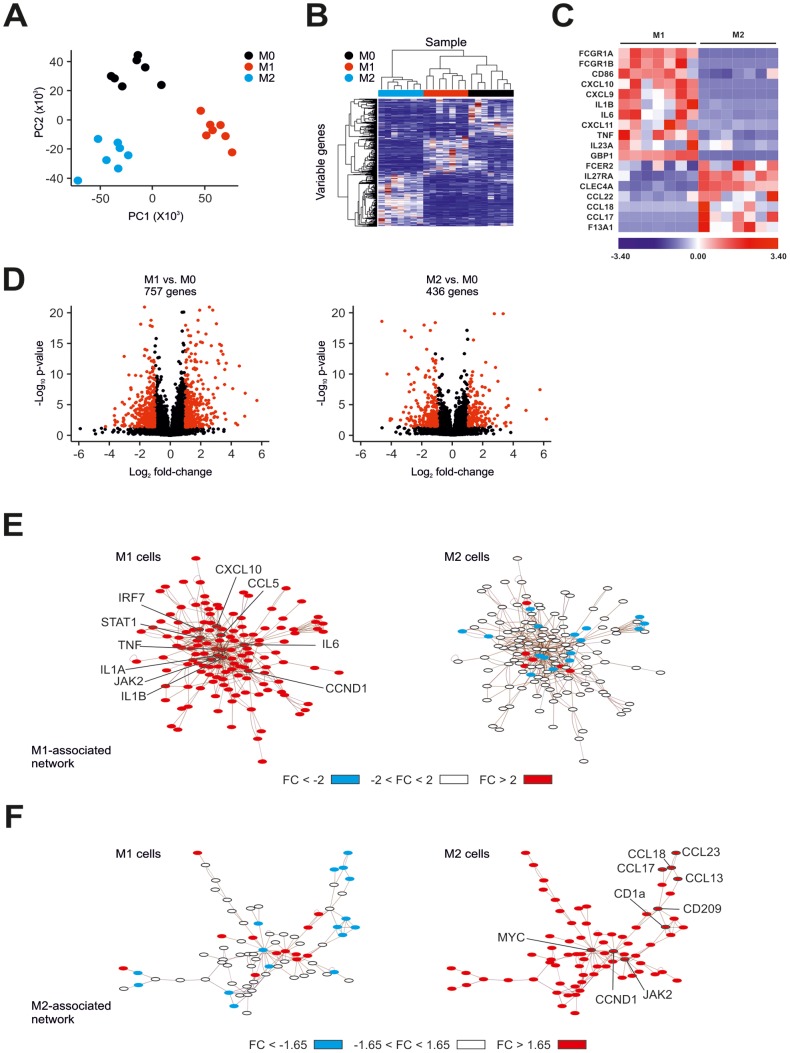
Figure 2. Microarray-based RNA fingerprinting of human M1- and M2-like macrophages.
(A) Principle component analysis of human unpolarized (M0) and polarized (M1, M2) macrophages. (B) Unsupervised hierarchical clustering of human M0, M1-, and M2-like macrophages. (C) Visualization of known markers for human M1- and M2-like macrophages as a heatmap. Data were z-score normalized. (D) Volcano plots showing fold-change and p-value for the comparisons of M1-like versus M0 (left) and M2-like versus M0 macrophages (right). Differentially expressed genes (FC ≥2, p-value <0.05 with FDR, diff >100) are depicted in red. (E) Left: network of genes highly expressed in M1-like macrophages (fold-change >2.0) in comparison to M0 macrophages identified by microarray analysis. Right: data for the comparison of M2-like versus M0 macrophages were loaded into the M1-network. (F) Right: network of genes highly expressed in M2-like macrophages (fold-change >1.65) in comparison to M0 macrophages identified by microarray analysis. Left: data for the comparison of M1-like versus M0 macrophages were loaded into the M2-network. All networks were generated using EGAN.

