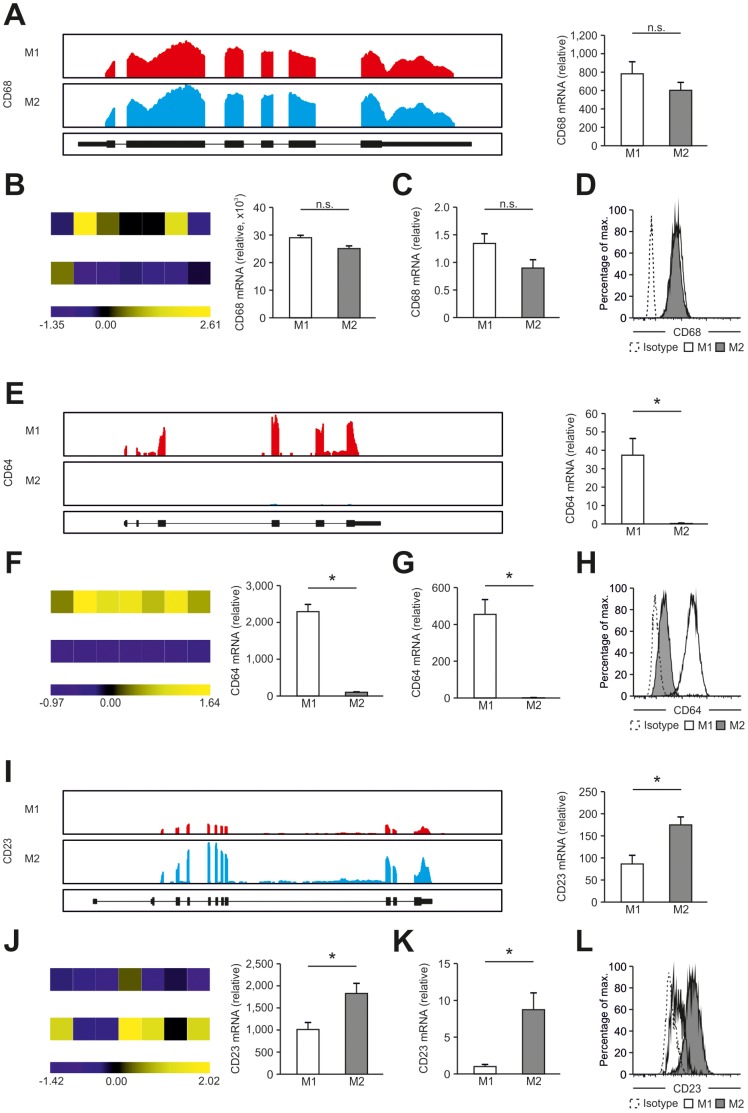
Figure 4. Correlation of RNA-seq, microarray, qPCR, and flow cytometric analysis.
(A–D) CD68, (E–H) CD64, and (I–L) CD23 expression in human M1- and M2-like macrophages. (A, E, I) Left, representative images of sequencing reads across the genomic loci of genes expressed in human macrophages. Pictures taken from the Integrative Genomics Viewer (IGV). The height of bars represents the relative accumulated number of 100-bp reads spanning a particular sequence. Gene maps (bottom portion of each panel, oriented 5′-3′ direction) are represented by thick (exons) and thin (introns) lines. Right, RPKM values by RNA-seq in M1- and M2-like macrophages. (B, F, J) Left, heatmaps presenting microarray results from M1- and M2-like macrophages from seven donors. Data were z-score normalized. Right, relative mRNA expression. (C, G, K) Relative mRNA expression by qPCR in M1- and M2-like macrophages. (D, H, L) Protein expression was determined by flow cytometry in human M1- and M2-like macrophages. Data are representative of three experiments (RNA-seq, mean and s.e.m.), seven experiments (microarray, mean and s.e.m.), at least seven experiments (qPCR; mean and s.e.m.), and nine experiments (flow cytometry), each with cells derived from a different donor. Isotype controls are depicted as dotted lines. *P<0.05 (Student’s t-test).

